
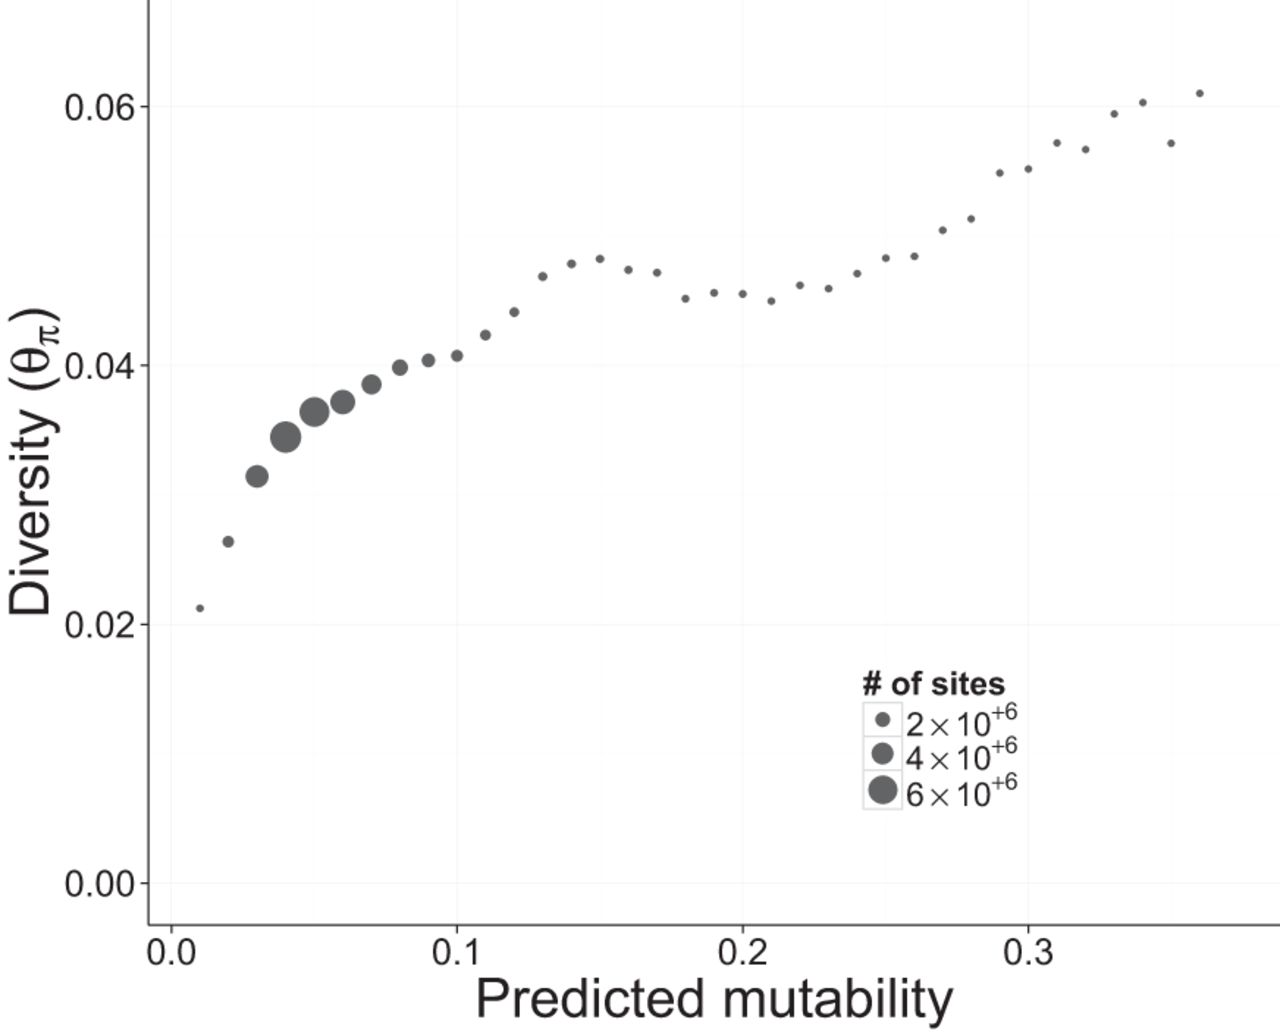
Figure 6.
Relationship between natural genetic diversity and predicted mutability. Each point represents multiple genomic sites placed in discrete bins (width = 0.01) based on the predicted mutability of each site. Only putatively neutral sites (intronic, intergenic, and fourfold degenerate sites) were included in this figure. Nucleotide diversity (θπ) was calculated in each bin from the six ancestral strains used to start the mutation accumulation lines. The size of each point is proportional to the number of sites in the genome with a given mutability.


