
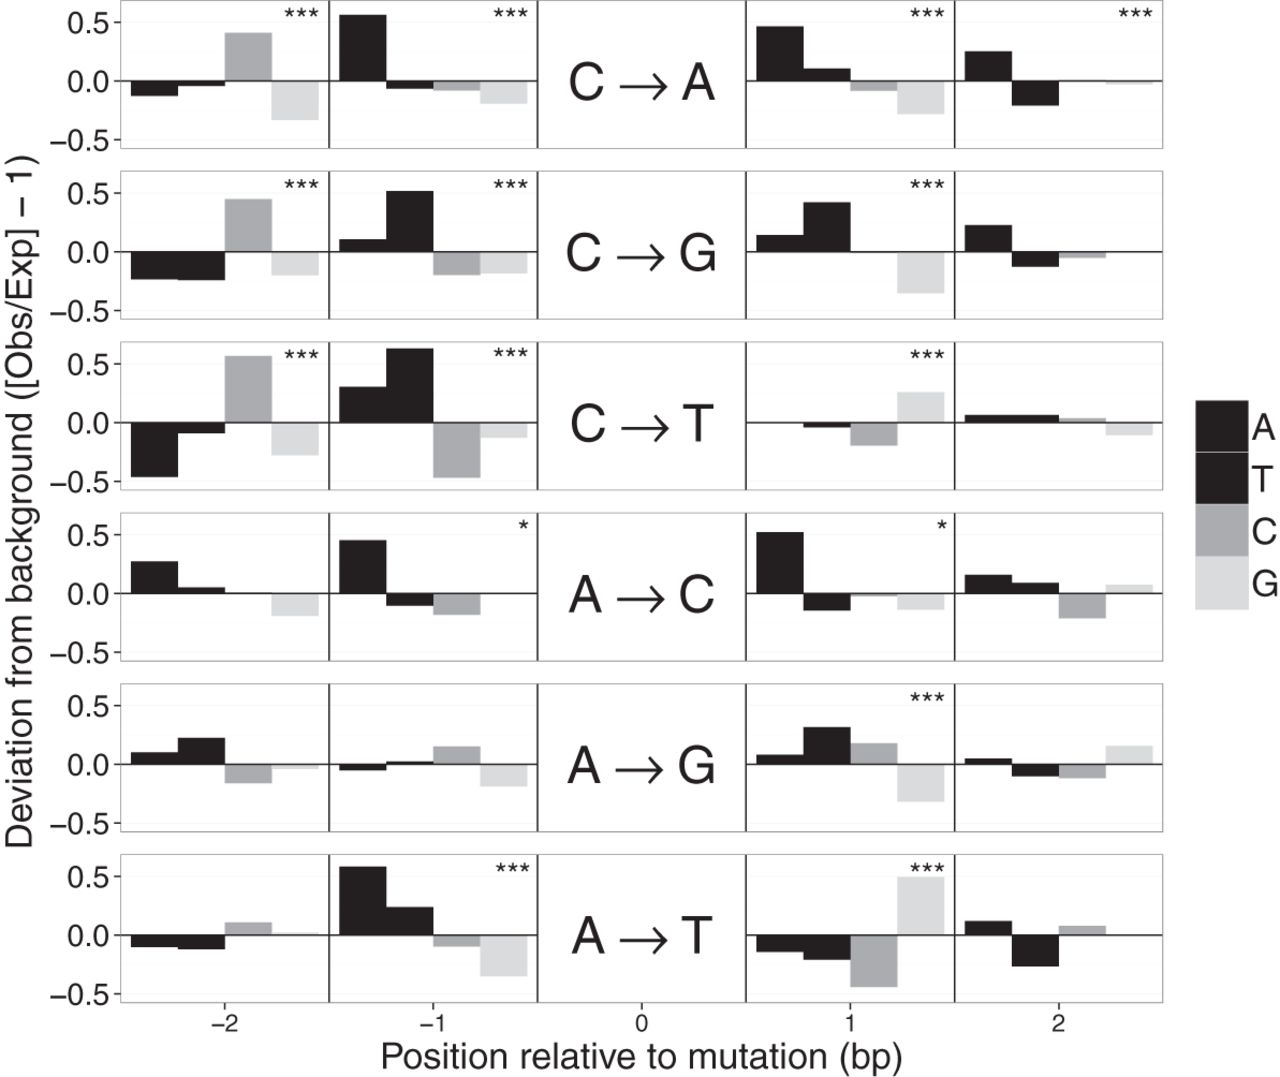
Figure 4.
Sequence context of spontaneous mutations. Deviations in the local sequence context of the 2 bp flanking mutated sites. Deviations were calculated from the observed frequency of each base (A, T, C, G) in the flanks of mutated sites and the expected background composition based on flanking sequences of 106 random A:T or C:G sites. Each horizontal panel represents one of the six possible mutations indicated in the center. Significant deviations from the background base composition at each position were detected with tests and indicated as (*) P < 0.05 or (***) P < 0.001 (α-values were adjusted for multiple tests using a Bonferroni correction).


