
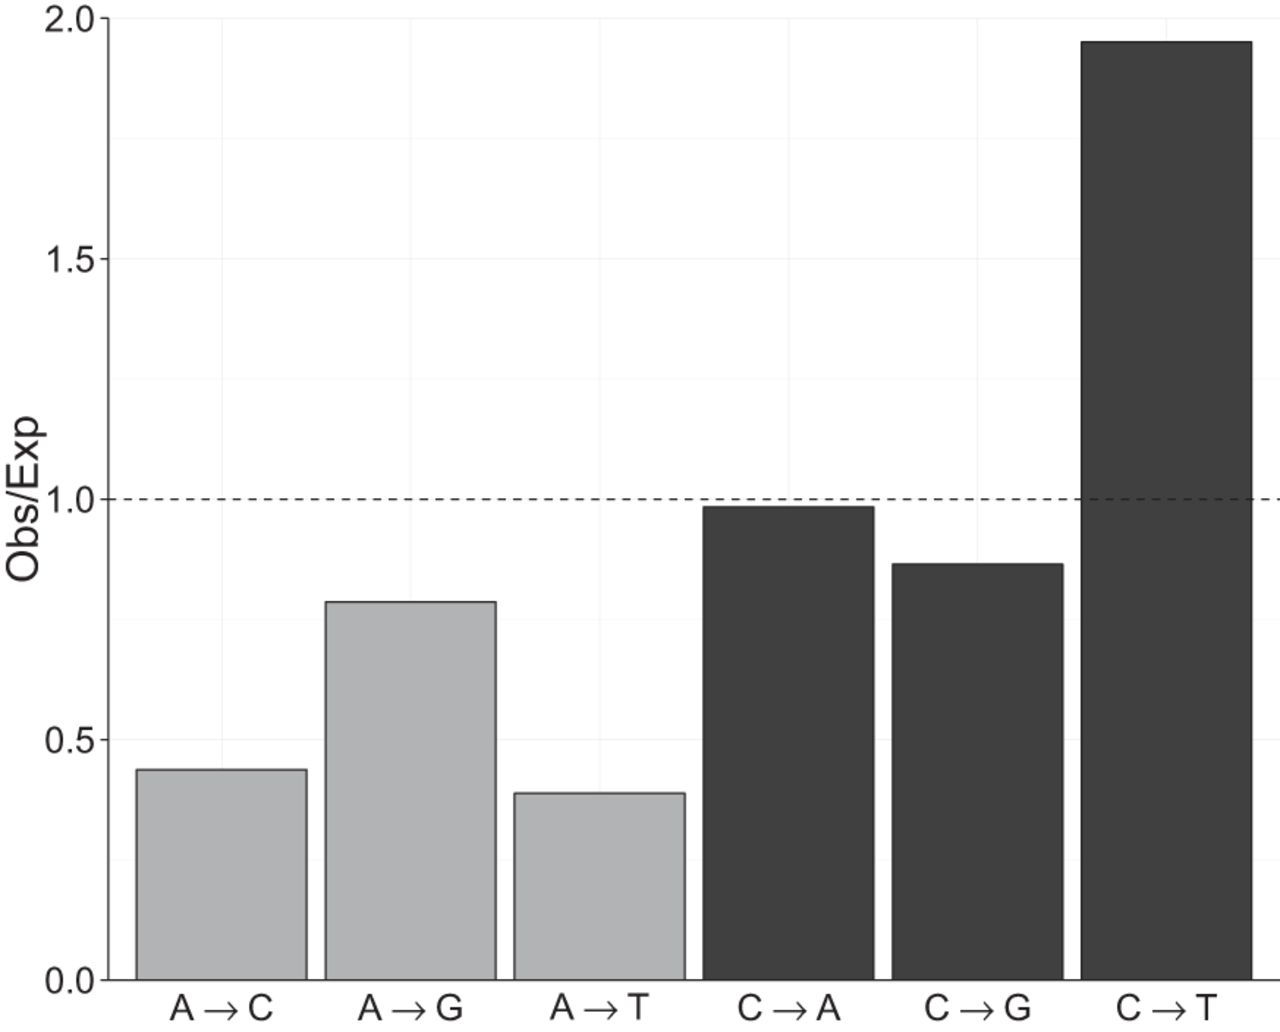
Figure 3.
Mutation base spectrum of single nucleotide mutations. Base mutation spectrum of 5716 single nucleotide mutations (SNMs). The deviation of the mutation rate for each of the six possible SNMs relative to its expectation based on equal mutation rates was calculated as the observed number of mutations of each kind divided by the number of mutations expected if mutations occurred randomly with respect to base. Background base composition was calculated only from sites that have high-quality genotype calls (callable sites).


