
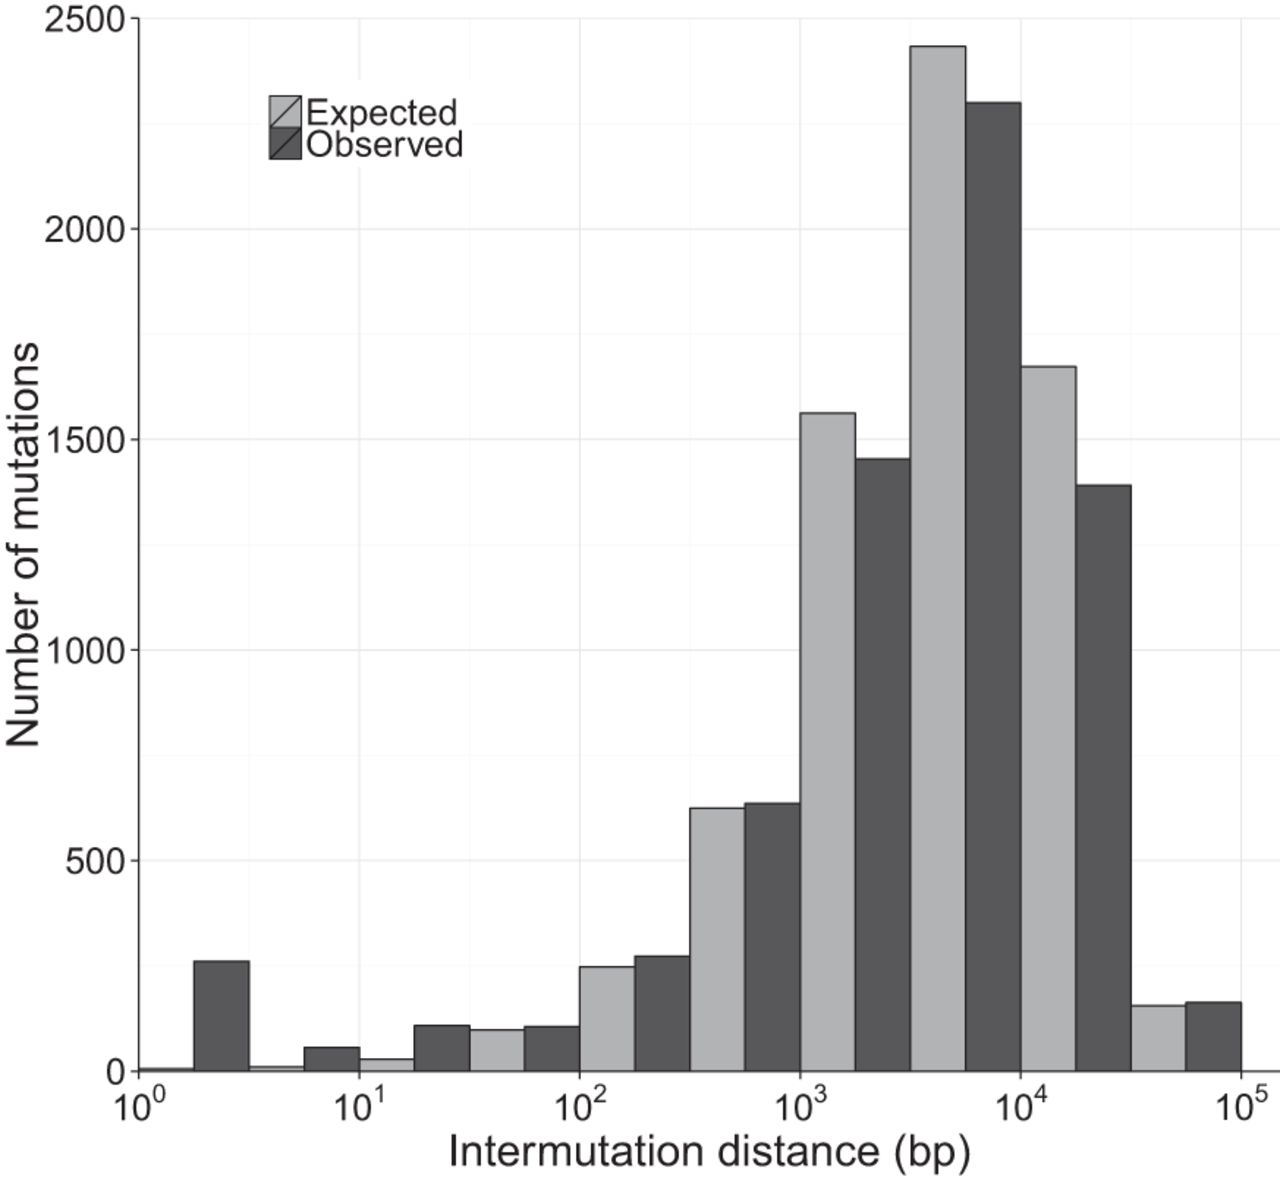
Figure 2.
Expected and observed distributions of inter-mutation distance. Comparison of observed (dark gray) and expected (light gray) distributions of the distance between mutations. In this plot, inter-mutation distance was measured as the nearest mutation irrespective of the MA line or strain it occurred in. The expected distribution was generated by randomizing the location of mutations in each MA line and recalculating the inter-mutation distances. The simulation was repeated 1000 times, and the average of those iterations is shown here.


