
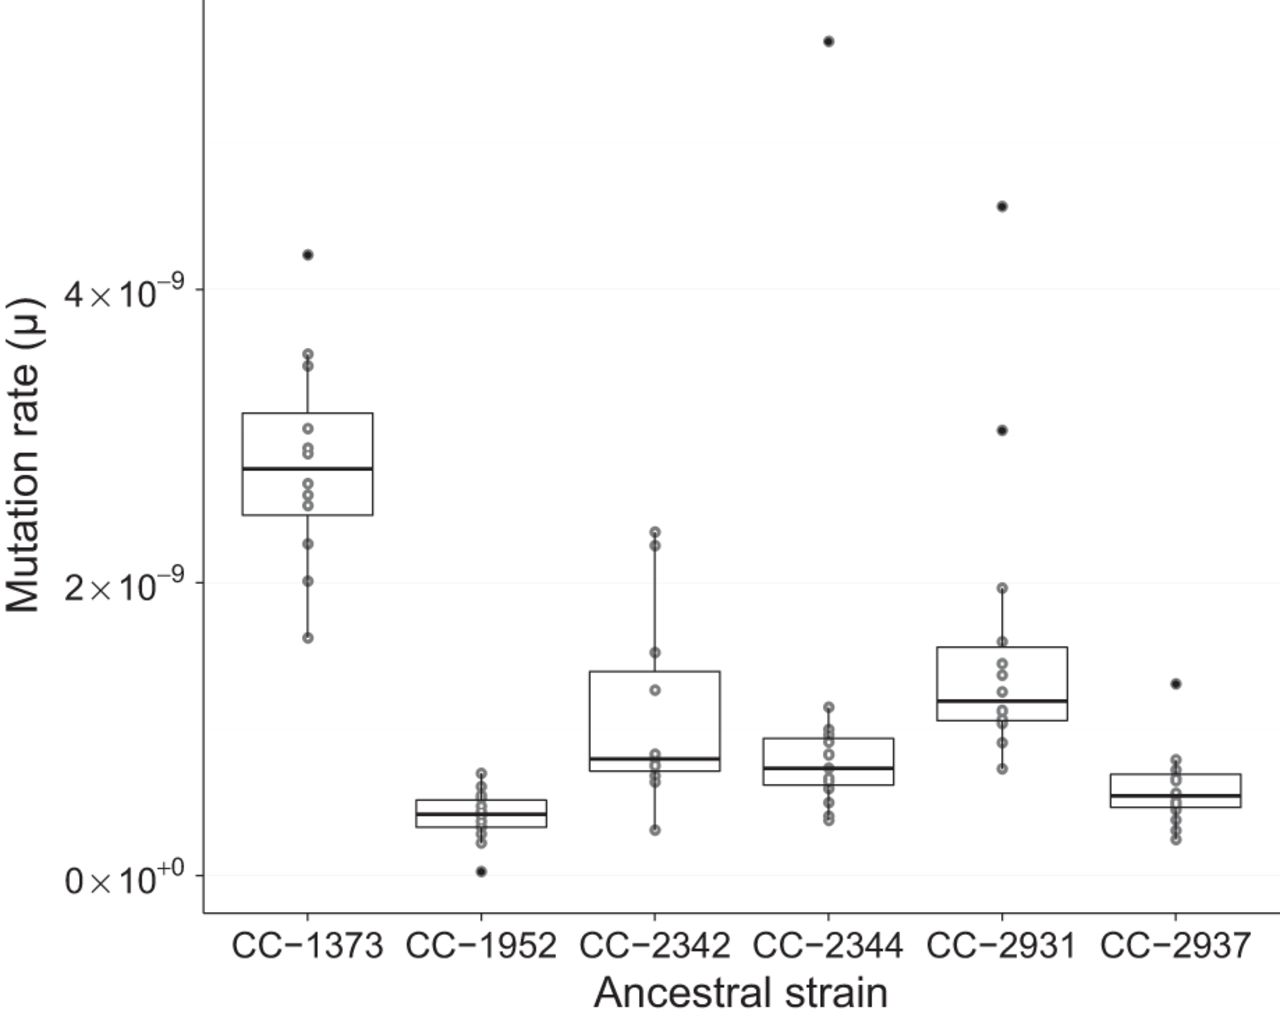
Figure 1.
Variation in mutation rate between strains. Mutation rate (µ = mutations/[sites × generations]) for each of the MA lines, categorized based on their ancestral strain. The boxes outline the first to third quartile of the mutation rate in lines from a given ancestral strain, the horizontal lines within the boxes indicate the median mutation rate, and the whiskers extend to the last data point that is within 1.5× the inter-quartile range; points outside the whiskers are filled black.


