
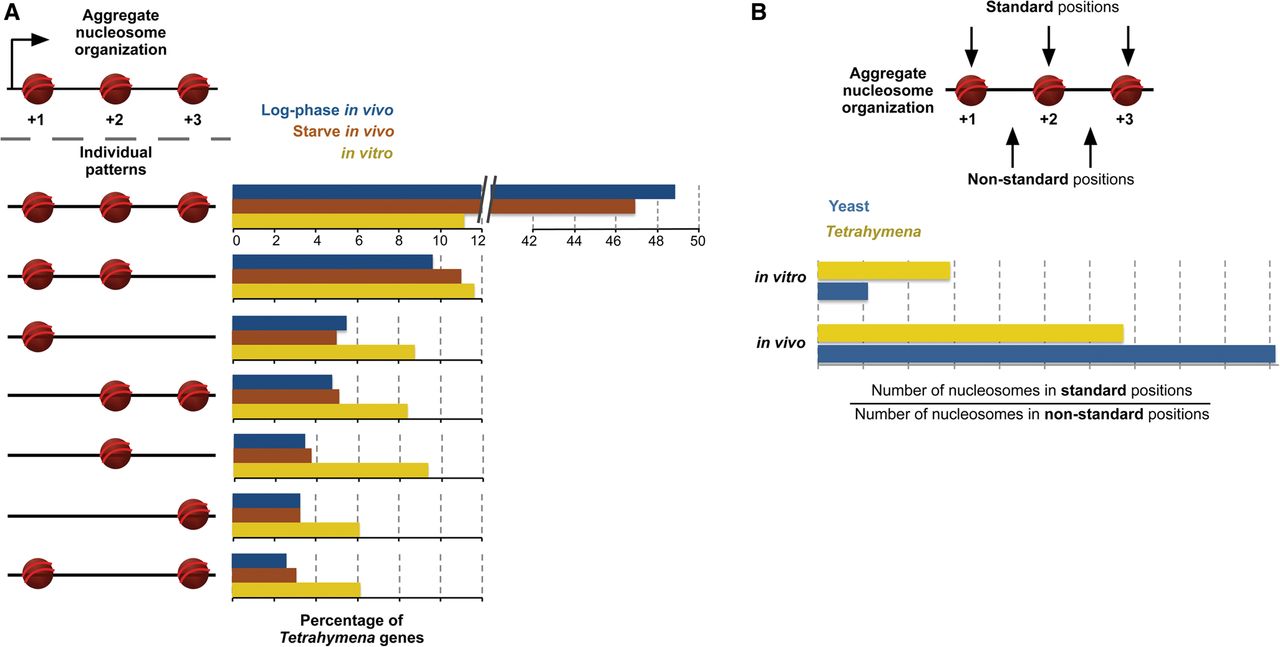
Distinct nucleosome patterns underlie similar aggregate patterns in Tetrahymena. (A) Individual genes were annotated as either possessing or lacking standard nucleosomes at the +1, +2, and +3 positions. For example, the pattern represented by a nucleosome only at the +1 position denotes genes with a +1, but not a +2 or +3 nucleosome. Standard nucleosomes in individual genes were annotated if they lie ≤35 bp from the aggregate position. The aggregate positions are +113, +306, +498, for log-phase (in vivo); +114, +307, +497 for starve; and +122, +310, +505 for in vitro, as defined from the peak positions in Figure 1B. The dominant pattern for in vivo data sets is the full nucleosome array, while a distribution of patterns is observed for in vitro data sets. (B) Standard nucleosome positions are preferred in vitro for Tetrahymena but not yeast. For each gene, the number of nucleosomes in standard and “nonstandard” positions was calculated. Then, the ratio of the total number of standard nucleosomes to nonstandard nucleosomes was calculated across all genes. Standard nucleosomes are defined as in A. Nonstandard nucleosomes lie ≤35 bp from the midpoint between the aggregate +1/+2 and +2/+3 positions, respectively. These are calculated as (113 + 306)/2 = 210 and (306 + 498)/2 = 402 for log-phase; (114 + 307)/2 = 211 and (307 + 497)/2 = 402 for starve; (122 + 310)/2 = 216 and (310 + 505)/2 = 408 for in vitro. As expected, the standard/nonstandard nucleosome ratio is high in vivo for both organisms. However, this ratio is threefold as high in vitro for Tetrahymena compared to yeast.


