
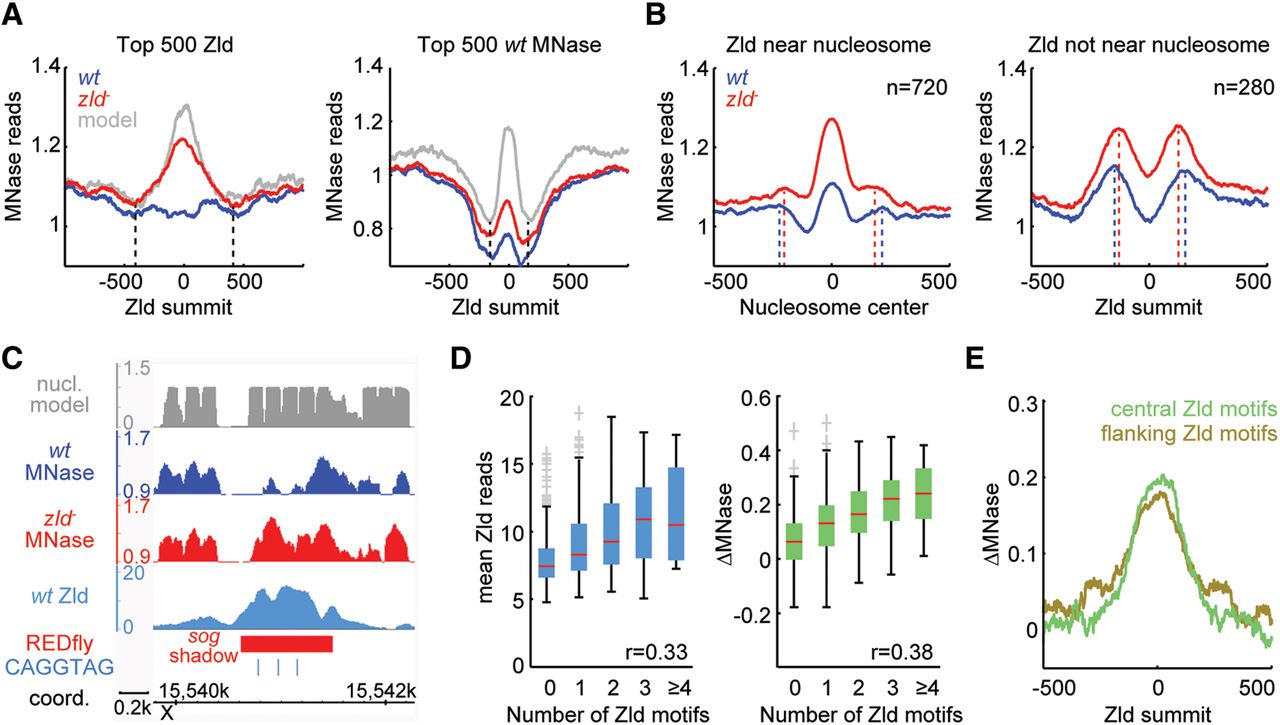
The effect of Zld on nucleosome occupancy is predominantly local. (A) Metaprofiles of nucleosome occupancy for the top 500 non-TSS Zld-bound regions as in Figure 3B, which are enriched for early enhancers (left), and the top 500 wt MNase regions (the most open regions) as in Figure 3C (right). For both plots, normalized MNase reads for wt (blue) and zld− (red), as well as the predicted nucleosome occupancy (gray) (Xi et al. 2010), were aligned to the Zld summits. Note the difference in width of the region with high nucleosome occupancy (black vertical dashed lines), suggesting that early enhancers have extended regions of high nucleosome occupancy. (B) Nucleosome positions in zld− MNase data were identified for the top 1000 non-TSS Zld-bound regions using the nucleR package (Flores and Orozco 2011). If the Zld summit mapped within 75 bp of a nucleosome center (n = 720), the normalized MNase data for wt (blue) and zld− (red) were aligned at the center of that nearest nucleosome (left). For the remaining Zld-bound regions without a nucleosome within 75 bp (n = 280), the data were aligned at Zld summits (right). Note that in both plots, there is a notable shift for the nucleosome phasing between wt (blue) and zld− (red), indicated by dashed lines. (C) IGB views showing predicted nucleosome model (gray track), wt MNase (blue track), zld− MNase (red track), Zld binding (light blue track), REDfly enhancer (red rectangle), and CAGGTAG Zld motifs (light blue vertical lines) at the sog shadow enhancer region. (D) Box-and-whisker plots showing Zld binding (as mean ChIP reads; left) and ΔMNase (the read count difference between zld− and wt; right) for the top 1000 non-TSS Zld peaks dependent on the number of Zld motifs within 125 bp of the Zld summits. The whiskers denote the interquartile range, and gray crosses mark outliers. Note that Zld binding and ΔMNase increase approximately linearly with increasing numbers of Zld motifs. (E) Metaprofiles of ΔMNase for regions with different configurations of Zld motifs among the top 1000 non-TSS Zld peaks. Regions with only 1 Zld motif within 125 bp of the Zld summit and at least one more Zld motif within 400 bp (flanking Zld motifs group; olive) have a wider profile than those with at least 2 Zld motifs confined within 125 bp of Zld summit and no more Zld motifs within 400 bp of the Zld summit (central Zld motifs group; green). Also note that the changes in nucleosome occupancy (ΔMNase) in the central Zld motif group, where the effect of Zld is confined, are strongest within 250 bp (1–2 nucleosomes) from the Zld summit, suggesting that Zld acts predominantly local.


