
Figure 5.
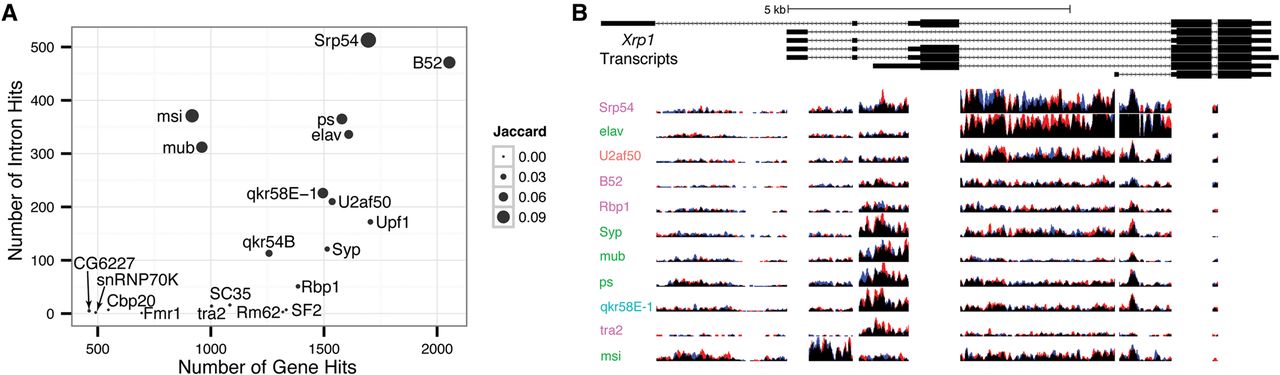
Retained intron signal in the data. (A) The number of intron and gene level targets is represented for each RBP on the y- and x-axes, respectively. The amount of overlap between each RBP's intron and gene level targets, as measured by the Jaccard index at the locus level, is indicated by each point's size. (B) The Xrp1 locus is indicative of several genes that produce different cohorts of RBPs binding to different retained introns. The exon regions of reads are removed from this figure. The height of each sequence track is 20 bases per kilobase per million mapped reads. Red and blue portions of the tracks indicate biological replicates.


