
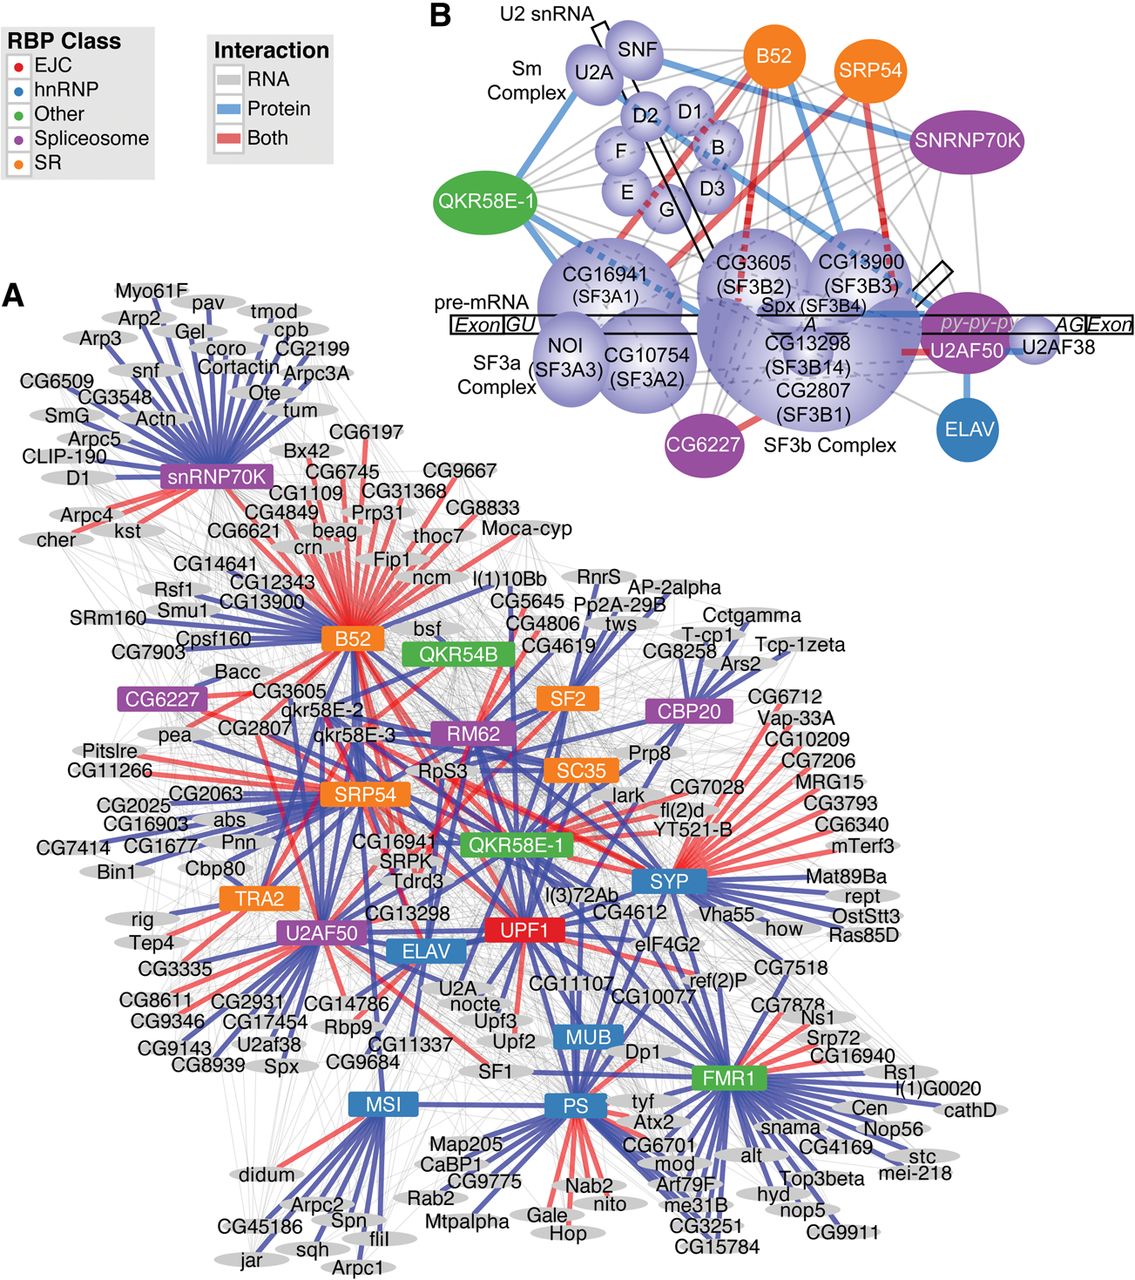
RBP–protein–RNA interactions. (A) Plot represents combined interactions between RBPs and all proteins pulled down in at least one experiment, as well as their corresponding transcripts. Edges are drawn where an RBP participates in an interaction with a gene. Gray lines indicate RBP–RNA interactions; blue lines, RBP–protein interactions; and red lines, both interactions with the same gene. (B) Diagram of the U2 snRNP (adapted from Kotake et al. 2007), showing the interactions between core proteins of the U2 snRNP and the RBPs from this study. Only those RBPs involved in protein–protein interactions are presented. The U2 snRNP is composed of U2 snRNA, the SF3a and SF3b splicing complexes, and the Sm proteins. Lavender-colored proteins are components of the U2 snRNP (along with U2AF50). RBPs from this study are colored according to their primary class designation used consistently throughout the article. Lines indicate the type of interaction as in A.


