
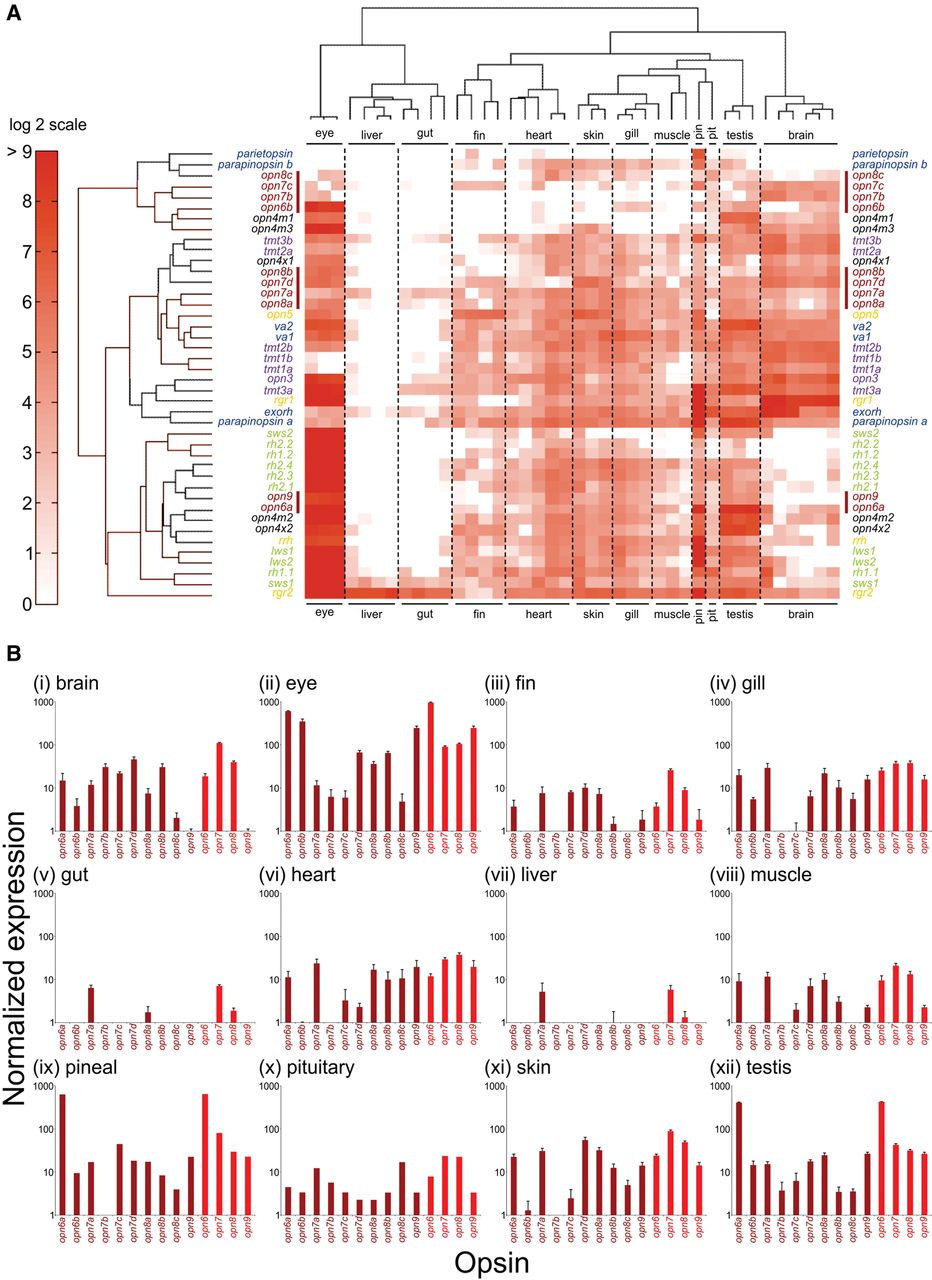
Gene expression profiling of zebrafish opsin transcripts using the NanoString nCounter assay. Adult zebrafish tissues (i, brain; ii, eye; iii, fin; iv, gill; v, gut; vi, heart; vii, liver; viii, muscle; ix, pineal [pin]; x, pituitary [pit]; xi, skin, and xii, testis) were dissected and processed as described in the Methods. (A) A heat map shows relative opsin gene expression on a log2 scale, with red and white indicating high and low expression, respectively. Each column represents an independent tissue sample, and each row represents a different opsin, which are color-coded by class as in Figure 2. A red bar further highlights the novel opsins. Hierarchical clustering of both the opsins (by Euclidean distance) and tissues (by correlation) organizes the data set into similar expression patterns. The widespread yet complex expression patterns in all tissues, except the liver and gut, are readily discernable. (B) Novel opsin gene expression (dark red) in different tissues, measured by NanoString, presented as bar charts on a log10 scale. Relative transcript data are shown for each distinct new opsin gene, as well as a total for each novel opsin class (i.e., opn6, opn7, opn8, and opn9) (light red).


