
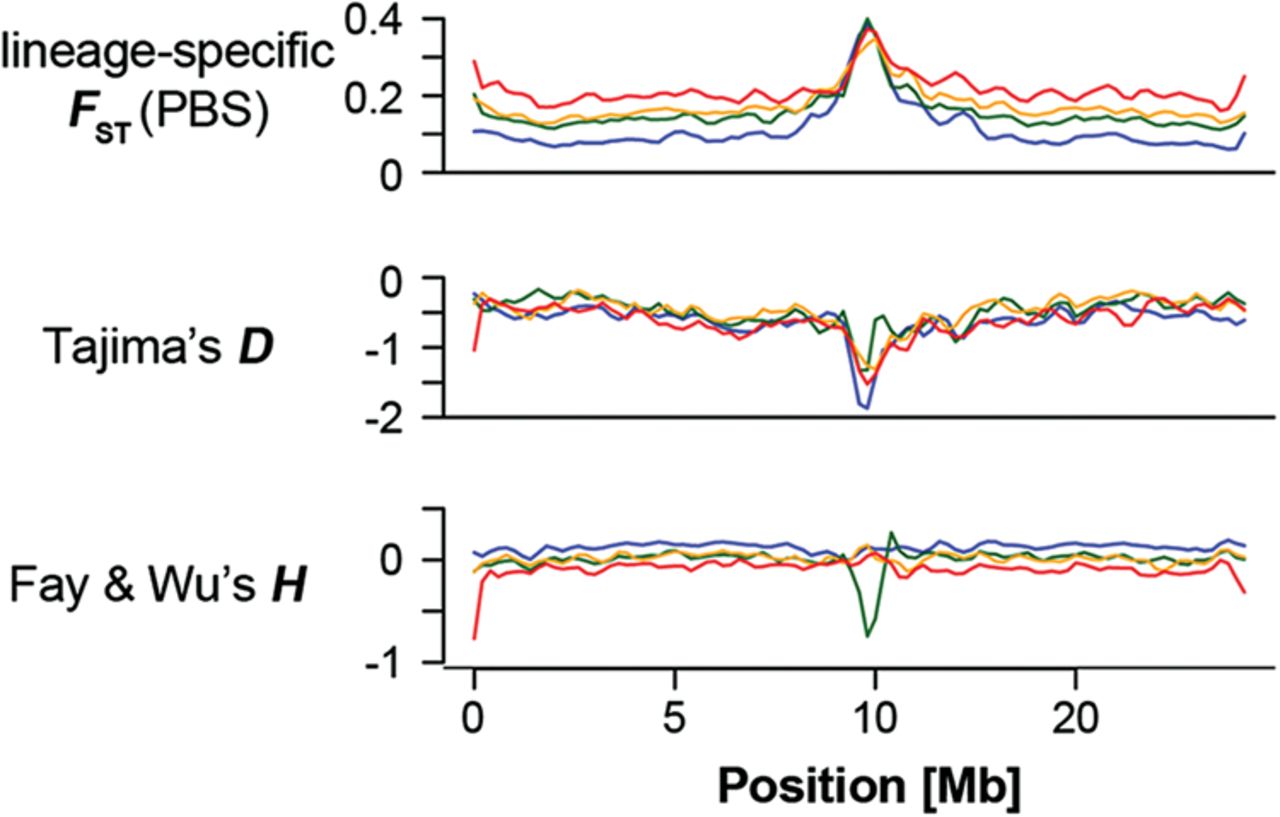
Figure 3.
Site-frequency spectrum statistics across an example chromosome (Chromosome 10). Color codes: (blue) collared; (green) pied; (orange) Atlas; (red) semicollared flycatcher. A signal of selection as indicated by negative Tajima's D is seen in the centrally located island in all species, while evidence for positive selection as indicated by negative Fay and Wu's H, i.e., an excess of high-frequency derived variants, is seen in only one species (pied flycatcher). See Supplemental Figure S2 for all chromosomes.


