
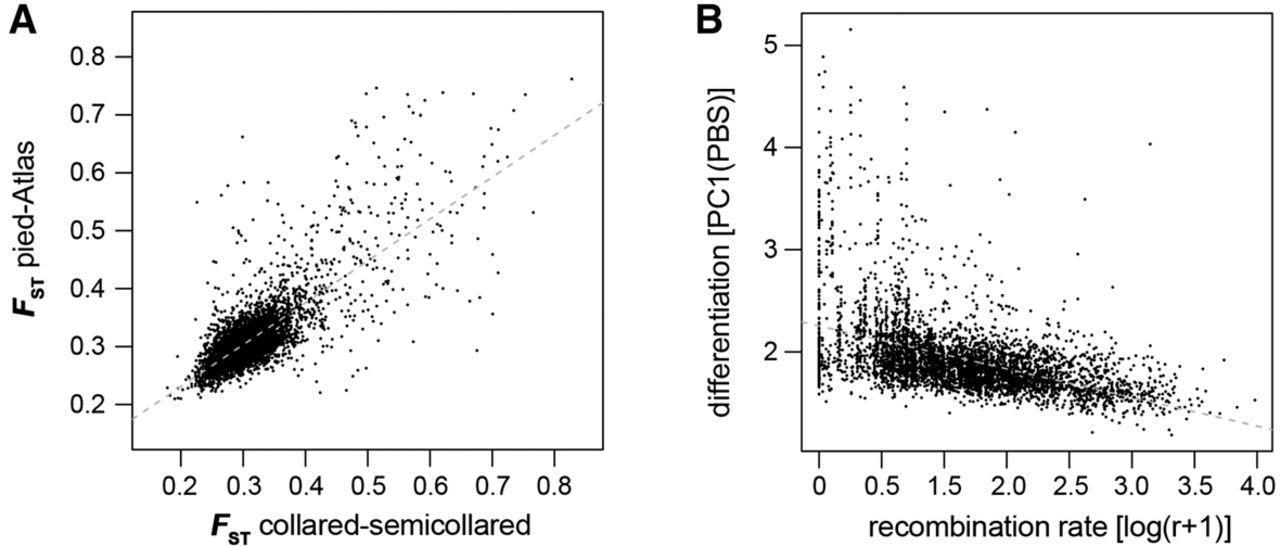
Figure 2.
Differentiation in independent lineages and its correlation with recombination rate. (A) Correlation of FST in 200-kb windows among two phylogenetically independent comparisons (Pearson's correlation: R = 0.804, t = 96.6, P < 10−15). (B) Relationship between differentiation and recombination rate (r, cM/Mb). Differentiation is expressed as the first axis (PC1) from a PCA on lineage-specific FST (PBS; linear regression, t = −40.7, P < 10−15, R2 = 0.266).


