
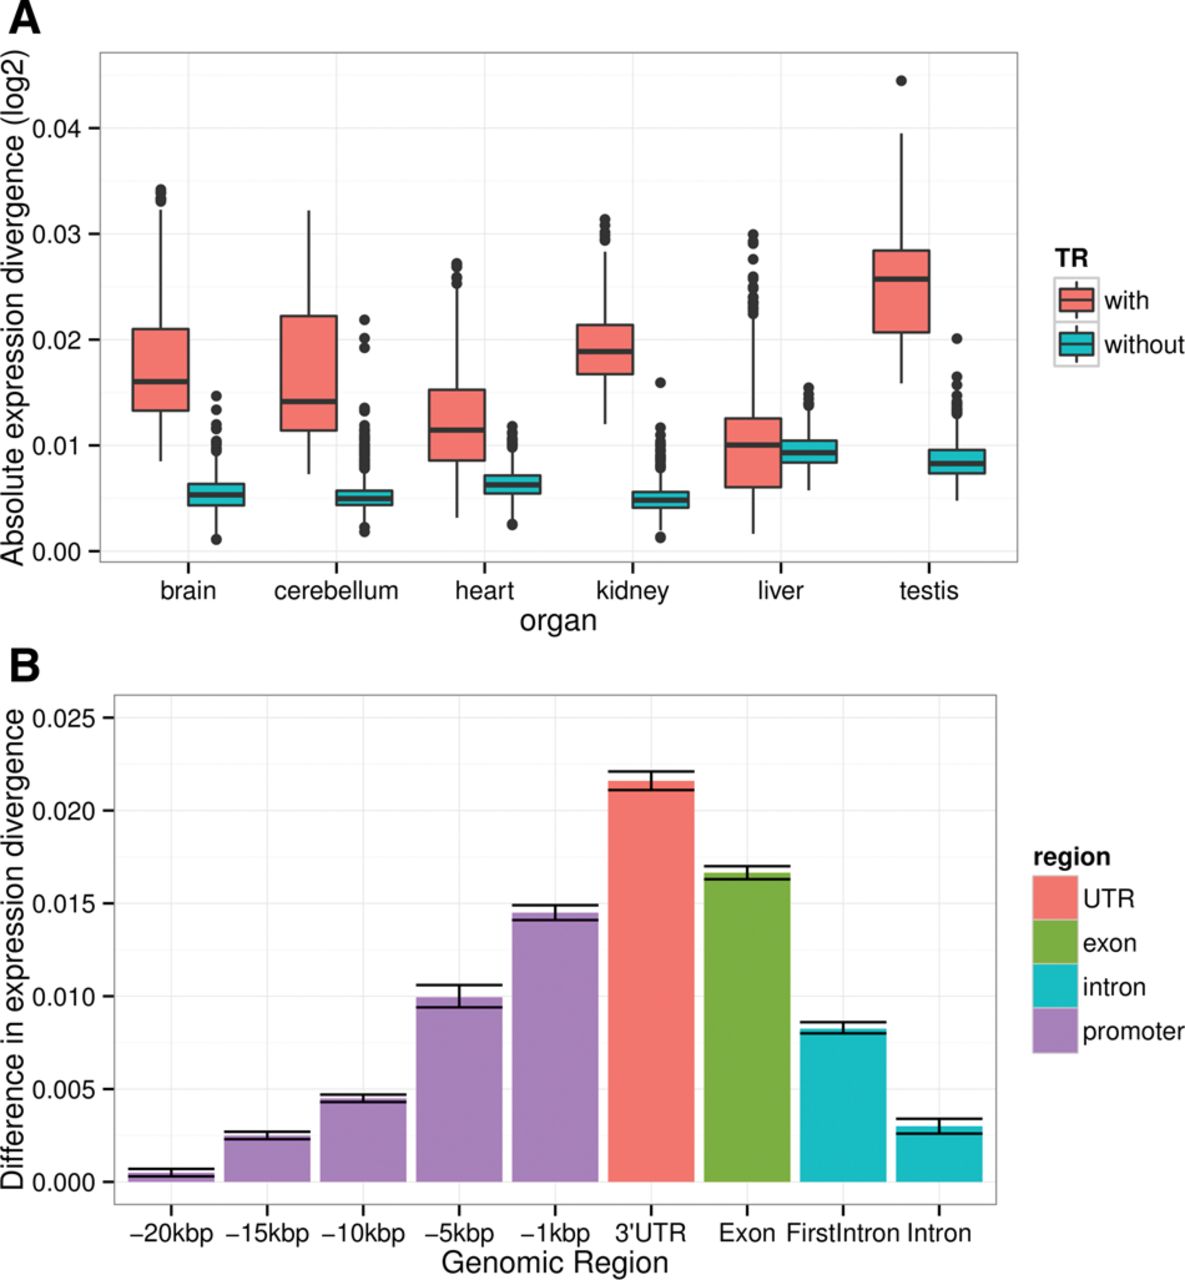
Relationship between expression divergence (normalized by mean tissue expression divergence) and the presence of repeats in gene promoters and other genic regions. (A) Boxplot of total tree lengths of genes with repeats (red) and genes without repeats (blue). Horizontal lines in the middle of each box mark the median, edges of boxes correspond to the 25th and 75th percentiles, and whiskers cover 99.3% of the data points. (B) Presence of tandem repeats associate with higher expression divergence. Bars, mean differences in expression divergence, based on pairwise expression tree length differences between repeat-containing and non-repeat-containing genes. Repeats found in upstream regions of lengths of 20, 15, 10, 5, 1 kbp, as well as in 3′ UTRs, exons, first introns, and all introns were considered, as indicated on the horizontal axis. Note that all expression differences are positive, indicating that repeat-containing genes, regardless of category, diverged more rapidly. Whiskers represent 99.3% confidence intervals.


