
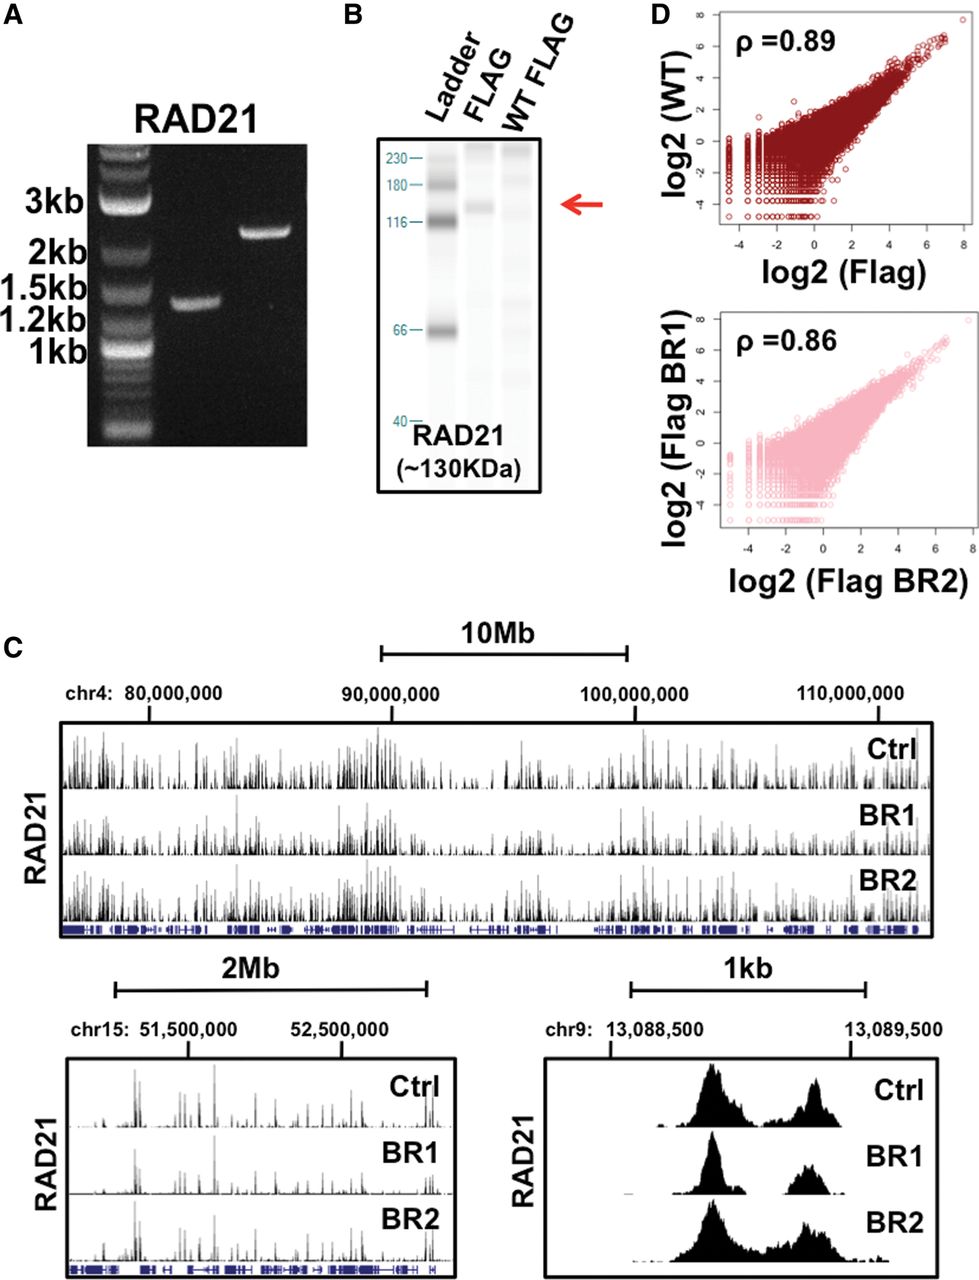
MCF7 ChIP-seq reproducibility and gene expression analysis. (A) PCR validation of RAD21 homologous recombination. From left to right, the gel image displays ladder, 5′ end, and 3′ end homology PCR products. Ladder band sizes are given at the left. Correct homologous recombination generates 1363-bp (5′) and 2278-bp (3′) gel bands. (B) Western blot validation of epitope-tagged RAD21. An ∼130-kDa protein band (marked by red arrow) corresponding to the predicted full-length size of RAD21 is visible in Western blots using a Flag antibody in CRISPR-modified cells but is absent in wild-type HepG2 cells. (C) DNA-binding protein read enrichment tracks on the UCSC Genome Browser are shown at distinct genome distance intervals. Data is given for CETCh-seq RAD21 biological replicates (BR1 and BR2, lower panels) and standard ChIP-seq using a RAD21 antibody (Ctrl, upper panels). (D) MCF7 RAD21 rank correlations of normalized sequence read counts between wild-type MCF7 cells (WT) using a RAD21 antibody and CETCh-seq Flag-tagged RAD21 (Flag) data sets (top). (Bottom) MCF7 RAD21 rank correlations of normalized sequence read counts between CETCh-seq biological replicates (Flag BR1 and Flag BR2). Average rank correlation values for all Flag replicate pairwise comparisons are given in the top left corner of each plot.


