
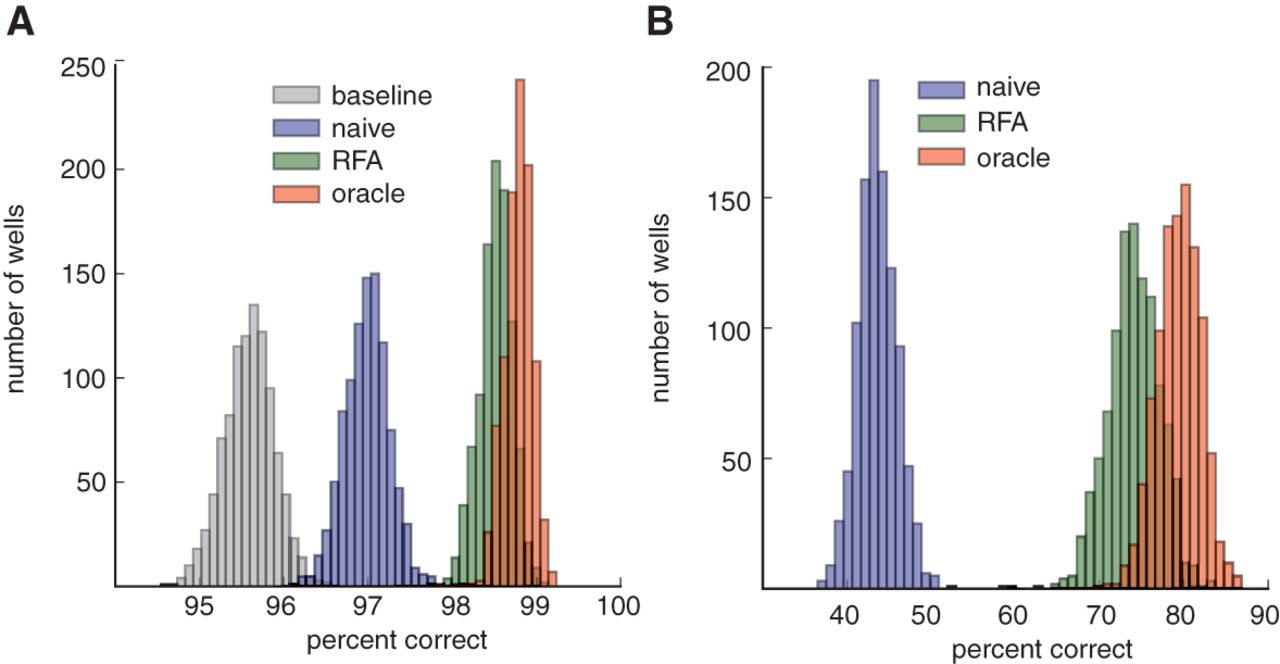
Figure 3.
Histograms of simulation results across 1000 wells. Each point in the histogram represents the result of a single simulated well. (A) All reads. (B) Only reads that were multimapped in the abbreviated reference. RFA confidently maps an additional 2.9% (out of 3.2% from Oracle) of the total reads over the Baseline approach, and achieves 92% of the Oracle performance.


