
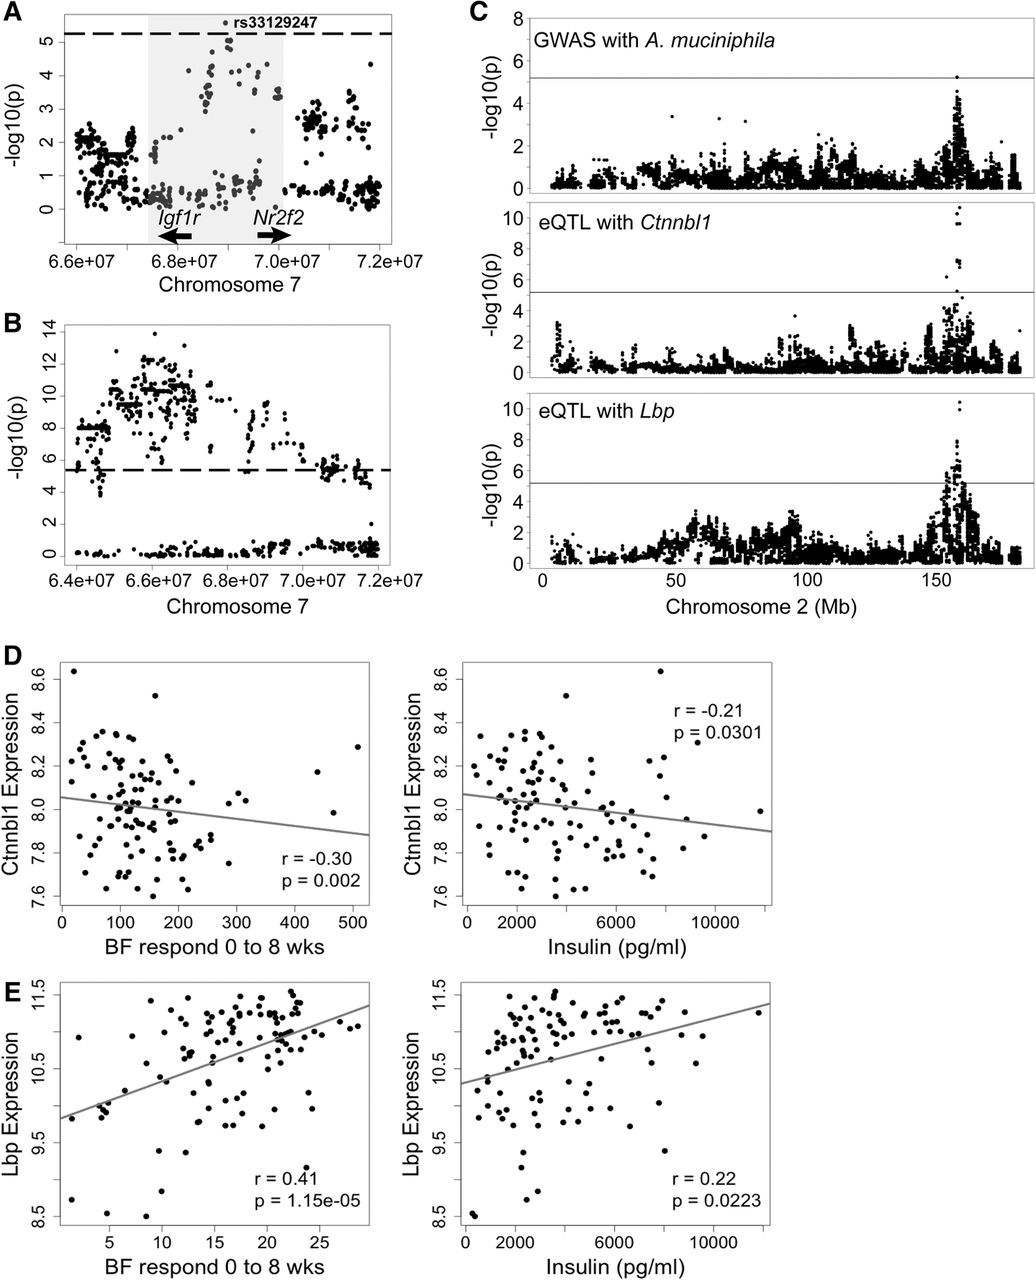
Chromosome 2 and 7 loci for abundance of A. muciniphila. (A) Locus plot for genome-wide significant association of A. muciniphila abundance to a Chromosome 7 locus, indicating the LD block (shaded in gray) and peak SNP rs33129247. Locations of candidate genes are indicated. (B) Locus plot for association with TG (triglyceride) at the Chromosome 7 locus. See also Supplemental Tables 6 and 7. (C) Chromosome 2 locus showing overlapping associations with the abundance of A. muciniphila and cis-eQTLs of the Ctnnbl1 and Lbp genes in adipose. (D) Correlation of epididymal adipose gene expression of Ctnnbl1 with body fat and insulin levels after 8 wk of the HF/HS diet. (E) Correlation of epididymal adipose gene expression of Lbp with body fat response and insulin levels after 8 wk of the HF/HS diet. (BF) Body fat, (r) biweight midcorrelation, (p) P value.


