
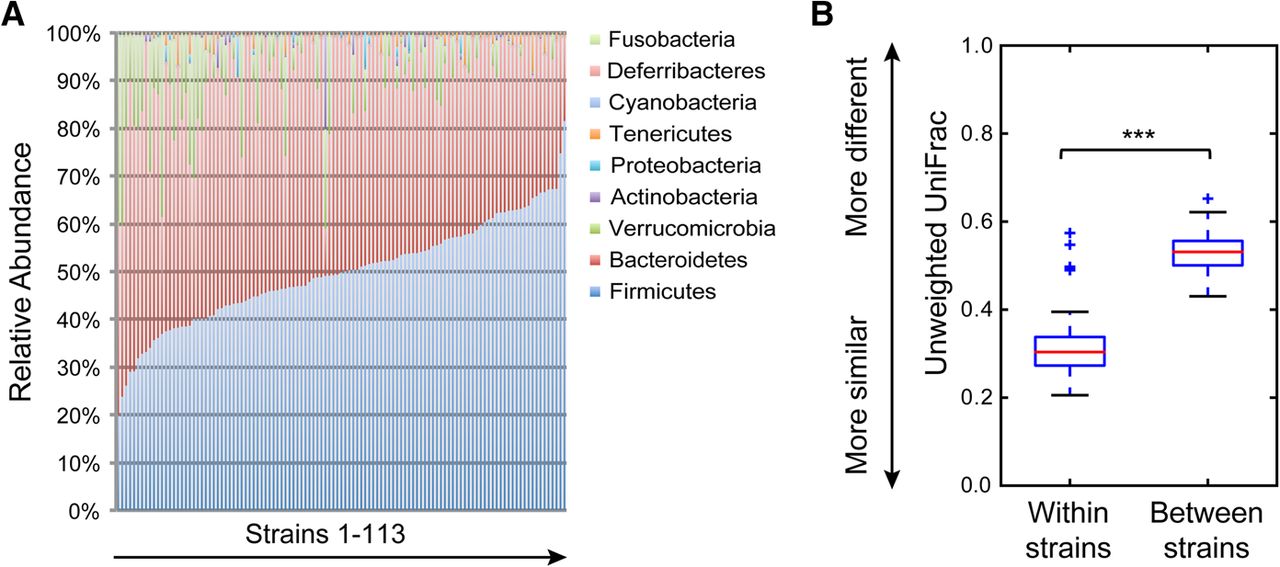
Figure 1.
Phylum-level variability of gut microbiota composition across 113 inbred strains of mice. (A) Columns represent the relative abundance of microbial phyla in 113 strains (327 male and 297 female). (B) Box plot of β diversity distances between microbial communities obtained when comparing mice within and between strains. The specific distance metric used is indicated on the axes. (***) P < 0.001 for Student's t-test with 1000 Monte Carlo simulations. See also Supplemental Table 2.


