
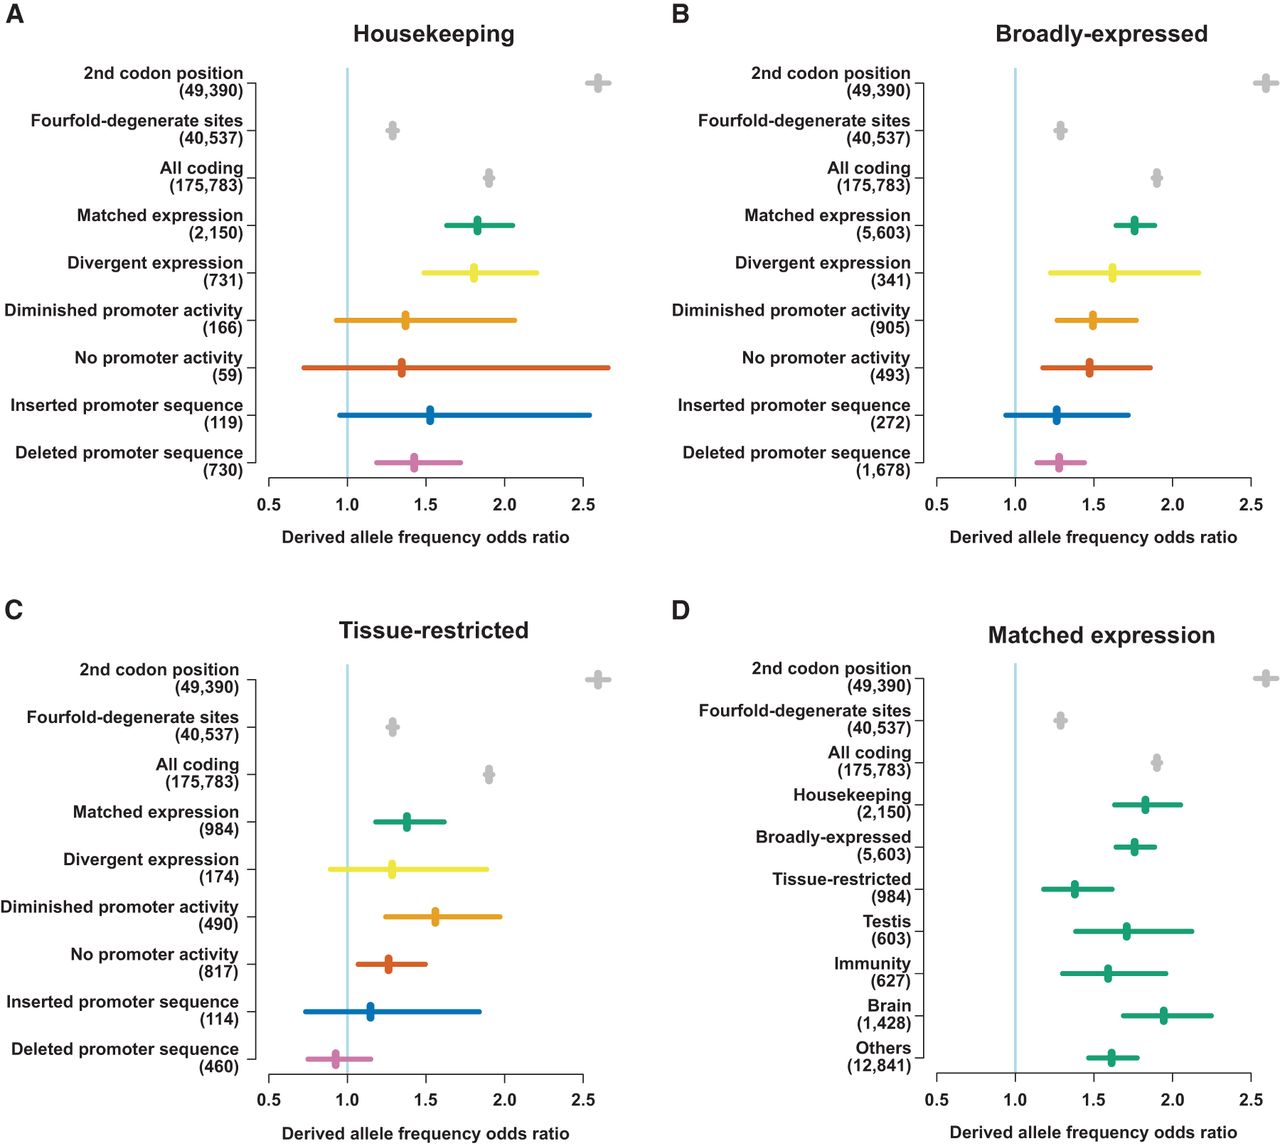
Derived allele frequencies in promoters of different evolutionary outcomes. (A–C) Odds ratios of derived allele frequencies for rare (<1.5%) and nonrare (>5%) derived alleles compared between the genome-wide distribution and the tested sequence category as labeled. Odds ratios of 1.0 indicate equality with the genome-wide distribution, higher values indicate relative selective constraint, and values <1 are indicative of net positive selection. Odds ratios for single nucleotide polymorphisms (SNPs) at the 2nd codon position, fourfold-degenerate sites and within all protein-coding sequence are shown in gray as points of reference for comparison. The numbers of informative SNPs overlapping each category are shown in parentheses next to the axis labels. (D) Derived allele frequency odds ratios for promoters with matched expression between species and different expression profiles and tissue biases. As in A–C, odds ratios for SNPs at the 2nd codon position, fourfold-degenerate sites, and within all protein-coding sequence are shown in in gray. The numbers of SNPs overlapping each category are shown in parentheses next to the axis labels.


