
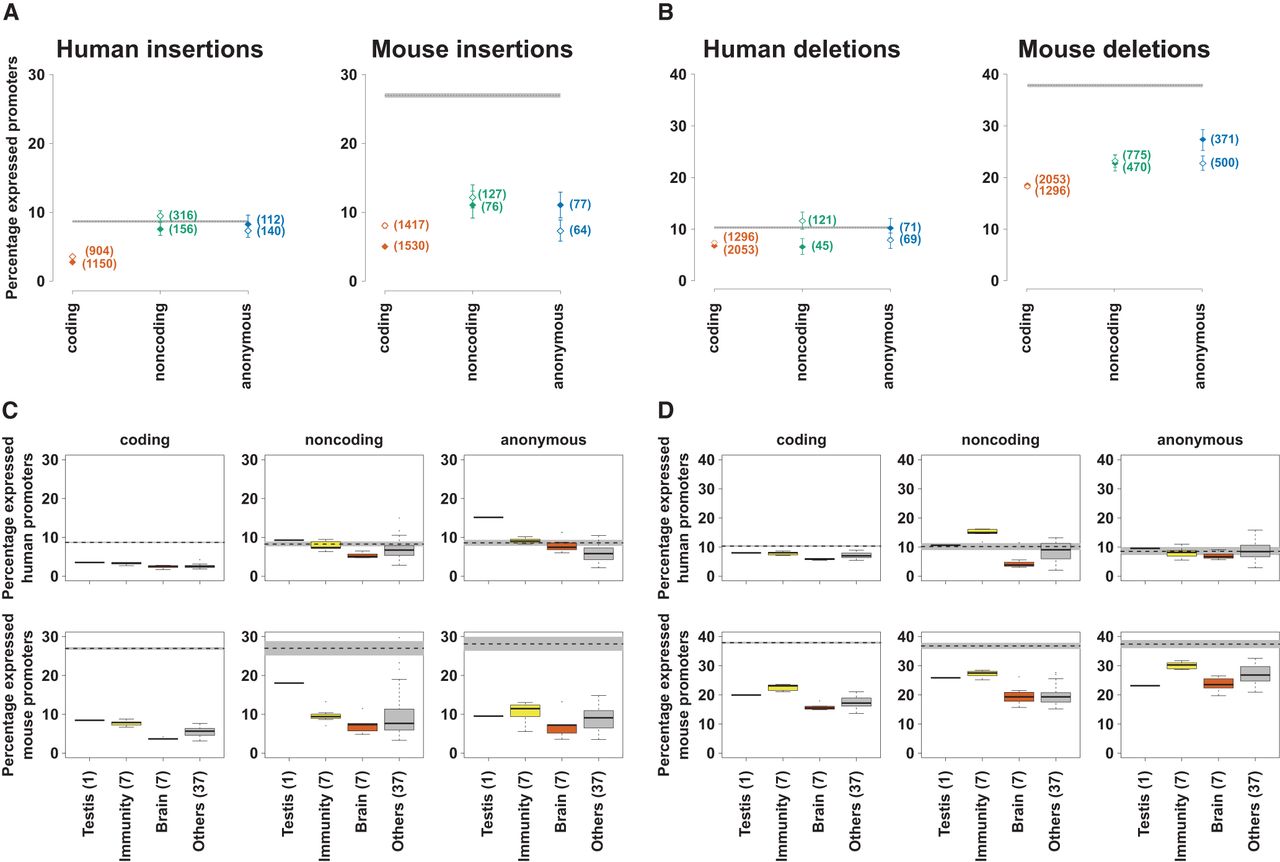
Recent promoter insertions and deletions in the human and mouse lineages. (A,B) The percentage of promoters of a particular class and expression profile which have been recently inserted (A) or deleted (B) in the human and mouse lineages. The closed diamonds represent broadly expressed promoters, while open diamonds show results for tissue-restricted promoters. The numbers of promoters in each category are shown in parentheses next to these points. The error bars represent the 95% confidence interval from 1000 samplings of the data with replacement. The gray bar shows the same 95% confidence interval for genome permuted intervals. The dashed line describes the mean of this expected distribution. (C,D) Percentage of promoters with tissue-biased expression that were inserted (C) or deleted (D), subdivided by biased tissue expression, where the number of samples for each tissue (described in Fig. 1F) is shown in parentheses. The gray bars show the 95% confidence interval for genome permuted intervals for each promoter class, while the dashed line shows the mean of this distribution.


