
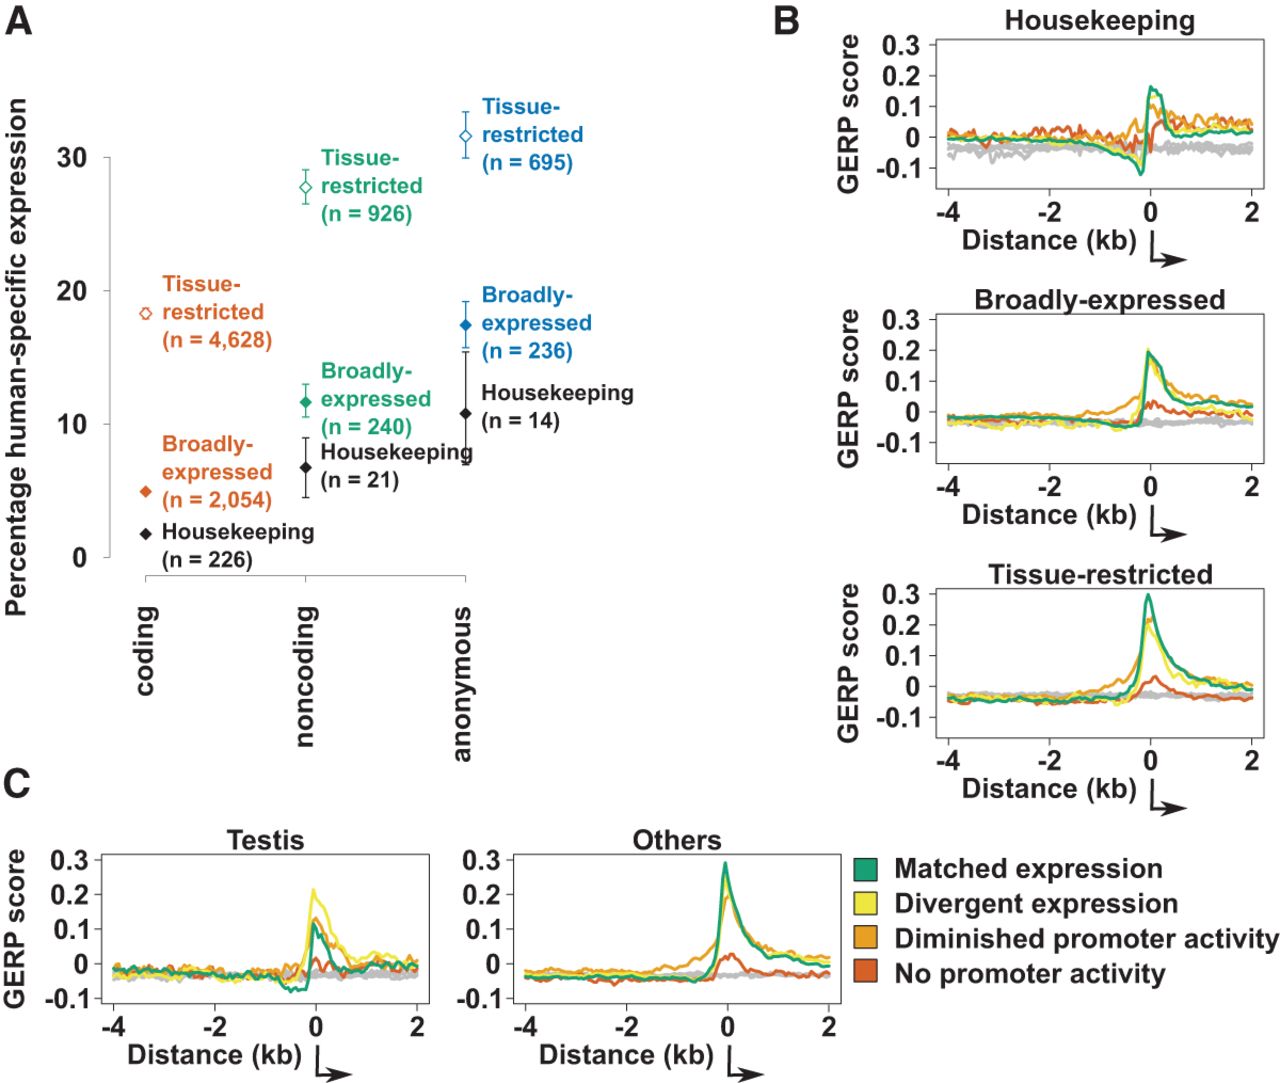
Expression turnover at aligned promoters. (A) The percentage of human promoters of a particular class and expression profile which can be aligned to mouse but show no transcriptional activity at the aligned position. The error bars represent the 95% confidence interval from 1000 samplings of the data with replacement. (B,C) Mean GERP conservation scores in 50-bp windows around human protein-coding promoters with different evolutionary outcomes. Gray lines indicate the GERP scores for genome permuted intervals. The standard error of these mean scores is negligible and not visible on this scale. The direction of transcription is shown by the black arrows. The sample sizes of promoters contributing to each line are detailed in Supplemental Table 3.


