
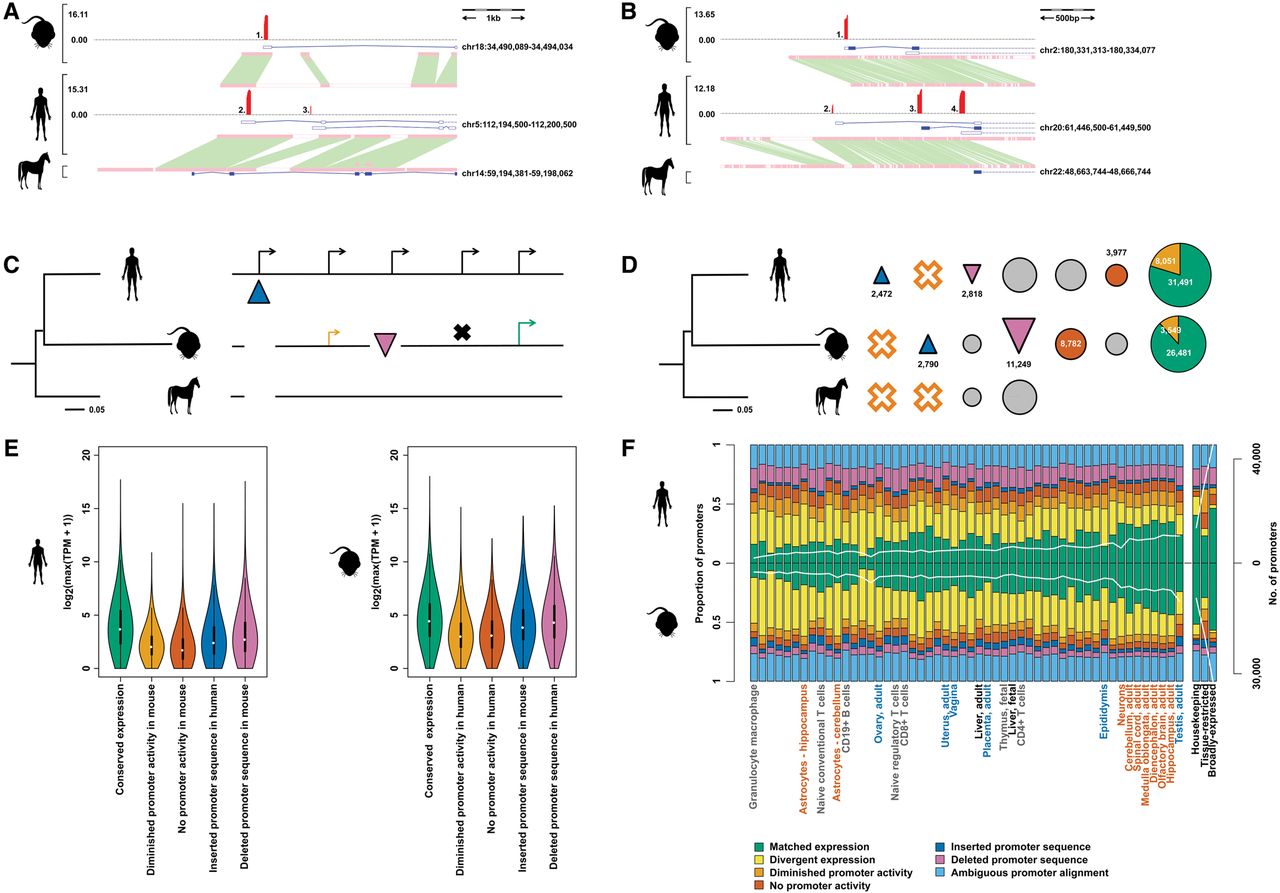
Evolutionary outcomes of human and mouse promoters. Horse is shown here as the example outgroup species, although promoters are identified as being present ancestrally if they are found in at least one, but not all, outgroup species (see Methods). (A,B) Example promoter insertions and deletions. Gene models supported by the CAGE promoters are shown in the blue boxes, where closed boxes represent coding exons and empty boxes noncoding exons. The histograms in red describe the log2-transformed expression level of the annotated promoters. Orthologous sequence identified between species is highlighted by the green boxes between these sequences. (A) Promoter insertion at the SRP19 locus in the human lineage. Promoters 1 and 2 are conserved, while promoter 3 has been inserted in the human lineage. (B) Promoter deletion at the Col9a3 locus in the mouse lineage. Promoters 1 and 3 are conserved, promoter 2 has been deleted in the mouse lineage, and promoter 4 has experienced expression turnover between human and mouse. (C) Schematic diagram showing each possible evolutionary fate of a human promoter. Promoters are denoted by the black arrows in human, where the blue triangle shows a recently inserted promoter in the human lineage and the purple triangle shows a recently deleted promoter in the mouse lineage. Aligned (black horizontal lines) promoters can show either matched (green arrow) or diminished (yellow arrow) expression in mouse. A human promoter which has completely lost its promoter ability in mouse is shown by the black cross. (D) Frequencies of inserted, deleted, aligned but no promoter activity (orange circles), or conserved (matched, divergent, and diminished) promoters in human and mouse. The lack of tissue-matched CAGE data from an outgroup species prevented us from assigning these expression changes to a specific lineage, so these events can only be classed as expression turnovers between human and mouse. The yellow segments in the conserved promoters show the proportion of promoters with diminished expression in the opposite species. (E) Maximum expression values for promoters with each evolutionary outcome as described and quantified in D in human (left panel) and mouse (right panel). (F) Proportion of promoters displaying each evolutionary outcome in human and mouse. Samples are ordered by rank of human:mouse average promoter count per sample. The white line denotes the number of promoters with that tissue bias or expression profile (right axis), and the frequencies of each evolutionary outcome for each tissue bias or expression profile are detailed in Supplemental Table 2. Tissues used in subsequent groupings (reproductive, blue; brain, orange; immunity, yellow) or mentioned directly in the text (liver) are labeled individually. This figure is reproduced as Supplemental Figure 1, where all tissues are labeled.


