
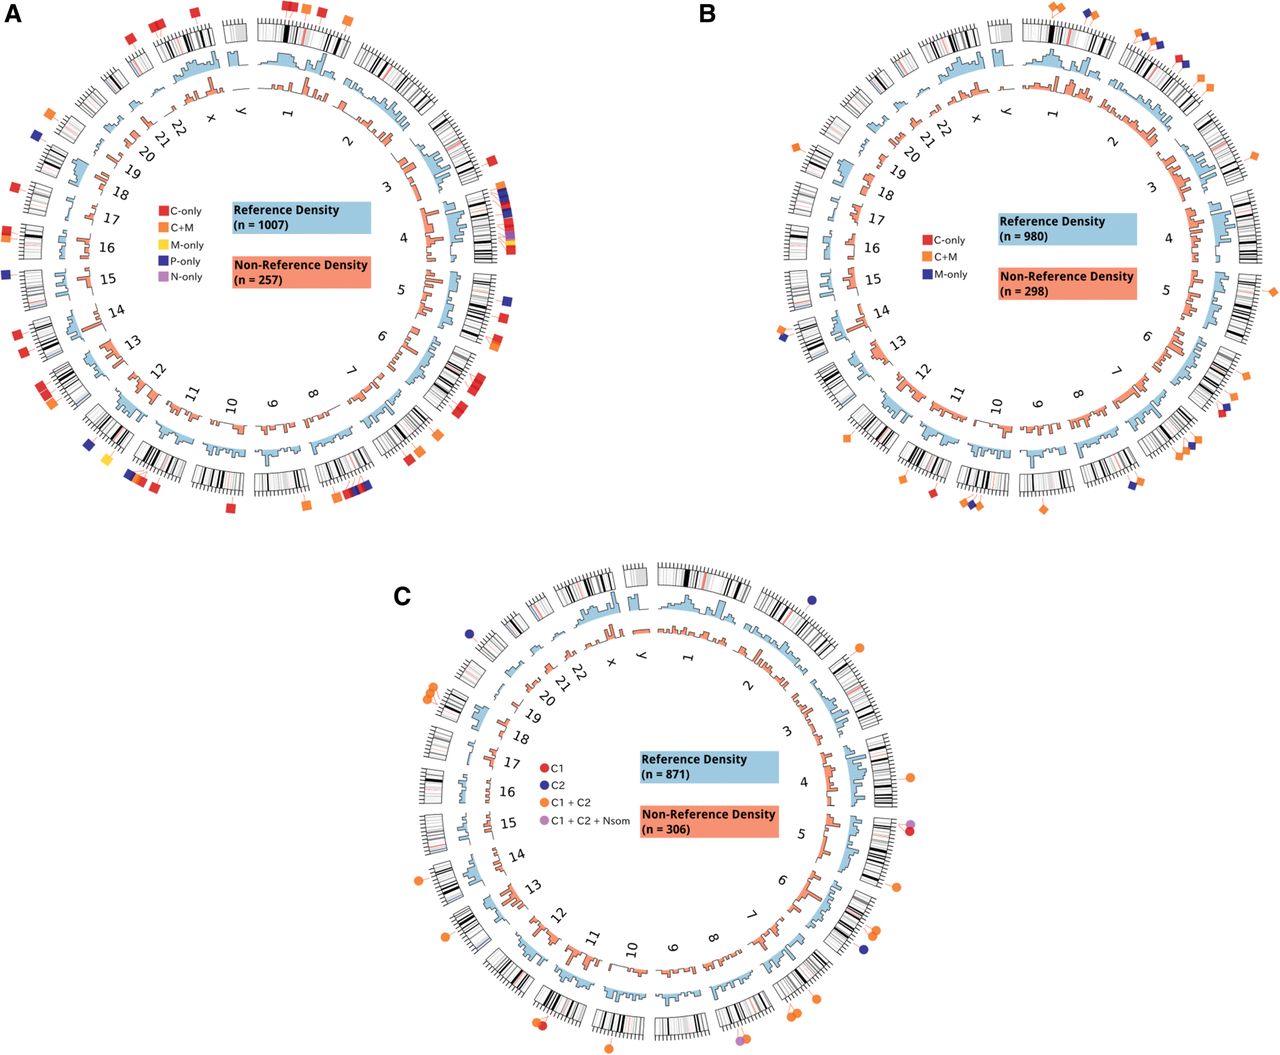
Genomic distribution of L1 insertions in GI tumors. (A) The genomic distribution of reference (light blue histogram) (Supplemental Table 3) and putative nonreference L1 insertions (light red histogram) (Supplemental Table 4) in colon cancer cases is shown as a density plot binned into 10-Mbp intervals across the genome. Somatic insertions validated by PCR and capillary sequencing (Supplemental Table 2) are shown on the outside. The tissue distribution for somatic insertions is shown according to the following key (see Table 1 for counts and Supplemental Table 2 for further details on insertion sites): (C) primary cancer, (M) metastasis, (P) polyp, (N) normal colon. (B,C) Shown similarly for pancreatic cancer samples in B and gastric cancer samples in C.


