
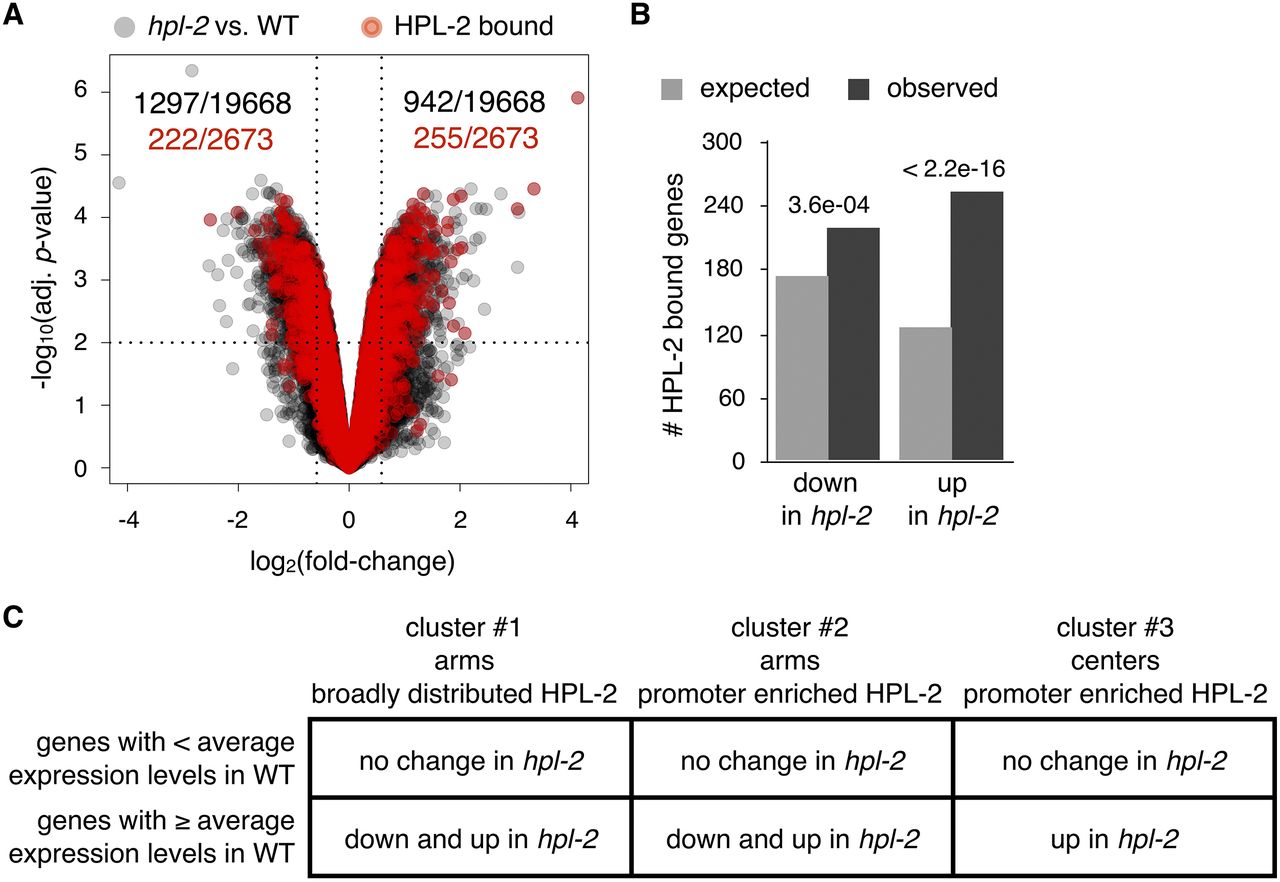
HPL-2 likely directly regulates the expression of some genes it binds. (A) Volcano plot depicting log2(fold-change) versus −log10(adjusted P-value) for mRNA levels of 19,668 genes from microarray transcript profiling of hpl-2 mutant embryos compared to wild-type (WT) embryos (gray), with genes that are bound by HPL-2 (red). Significantly misregulated genes were defined as those having mRNA levels that showed a fold-change of at least ±1.5 and an adjusted P-value < 0.01. (B) Expected versus observed numbers of genes that are bound by HPL-2 and significantly down- or up-regulated in hpl-2 mutants. Displayed P-values were calculated using the χ2 test. (C) Table showing how HPL-2-bound genes within the three clusters defined in Figure 5B displaying below- or equal-to-or-above-average expression levels in wild type change in hpl-2 mutants (P < 0.01). See Supplemental Figure S7 for histograms of the data.


