
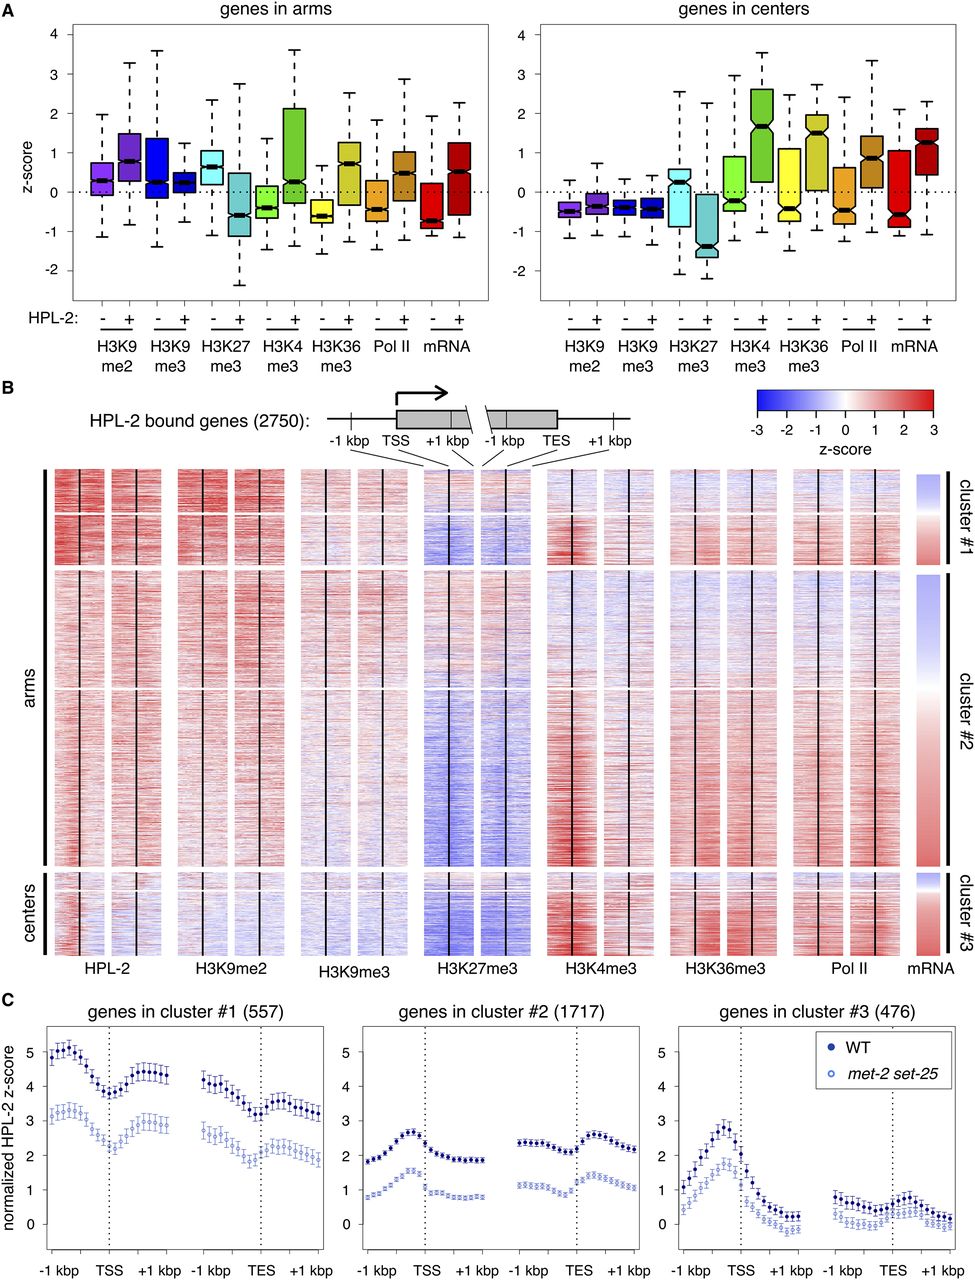
HPL-2 preferentially associates with well-expressed genes. (A) Box plots depicting median Z-scores of H3K9me2 (purple), H3K9me3 (blue), H3K27me3 (cyan), H3K4me3 (green), H3K36me3 (yellow), and Pol II (orange) ChIP-chip signal, as well as Z-scores of mRNA levels (red) of genes bound by HPL-2 compared to an identical number of randomly selected genes not bound by HPL-2 that reside either in chromosome arms or in centers. Levels of H3K9me2, H3K9me3, H3K27me3, H3K36me3, and Pol II are over the entire lengths of genes, while levels of H3K4me3 are over a 1-kbp region centered over transcription start sites (TSSs). (B) Heatmap depicting mean Z-scores of HPL-2, H3K9me2, H3K9me3, H3K27me3, H3K4me3, H3K36me3, and Pol II ChIP-chip signal centered around TSSs and transcription end sites (TESs) of individual HPL-2-bound genes, along with standardized wild-type mRNA levels. Red indicates enrichment, blue indicates depletion. HPL-2-bound genes in arms were divided into two groups based upon the distributions of HPL-2 around TSSs, using the base R functions hclust (method = “complete”), dist (method = “maximum”), and cutree (k = 2) (R Core Team 2014). (C) Normalized mean Z-scores, with 95% confidence intervals, of HPL-2 ChIP-chip signal from WT (dark blue) and met-2 set-25 (light blue) centered around TSSs and TESs for HPL-2-bound genes in the three clusters defined in panel B.


