
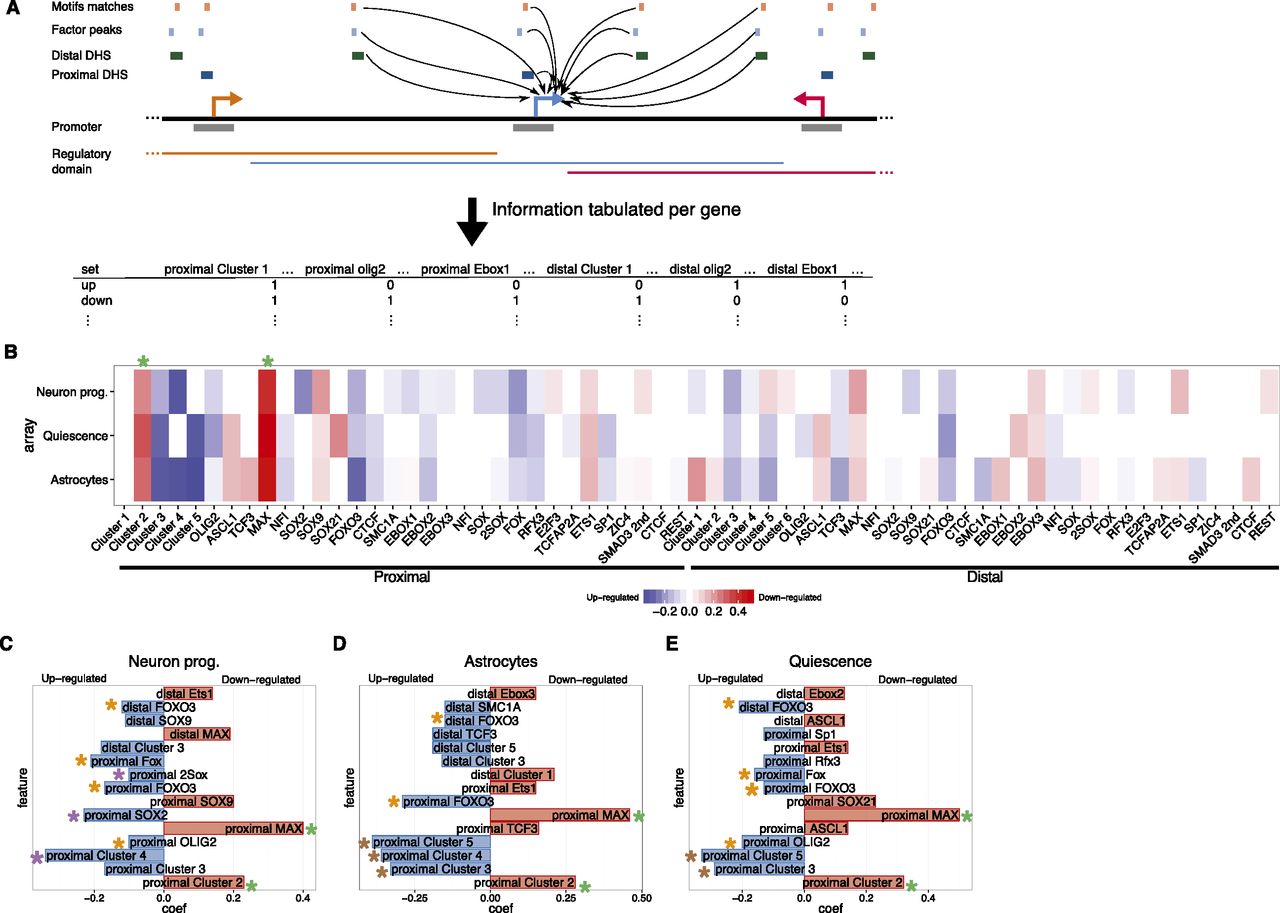
Modeling highlights genomic features predictive of genes regulated when NS cells exit self-renewal. (A) The occurrence of different proximal and distal DHS classes, with different motif matches and factor peaks, within the regulatory domains of genes is tabulated and used to generate logistic regression models to classify genes as up- or down-regulated when NS cells are differentiated or enter quiescence. (B) Heatmap of the model coefficients for each of the genomic features used (x-axis) in each cellular state (y-axis). Coefficients contributing to predictions of up-regulated genes are shown in shades of blue; for down-regulated genes, in shades of red. (C–E) Top 15 coefficients predictive of genes up- (blue) or down-regulated (red) in the individual models predicting genes responsive to neuronal (C) or astrocyte (D) differentiation, or to quiescence (E). Asterisks denote the features highlighted in the text. Note that transcription factor names are in uppercase for better differentiation from the motif names (first letter capitalized).


