
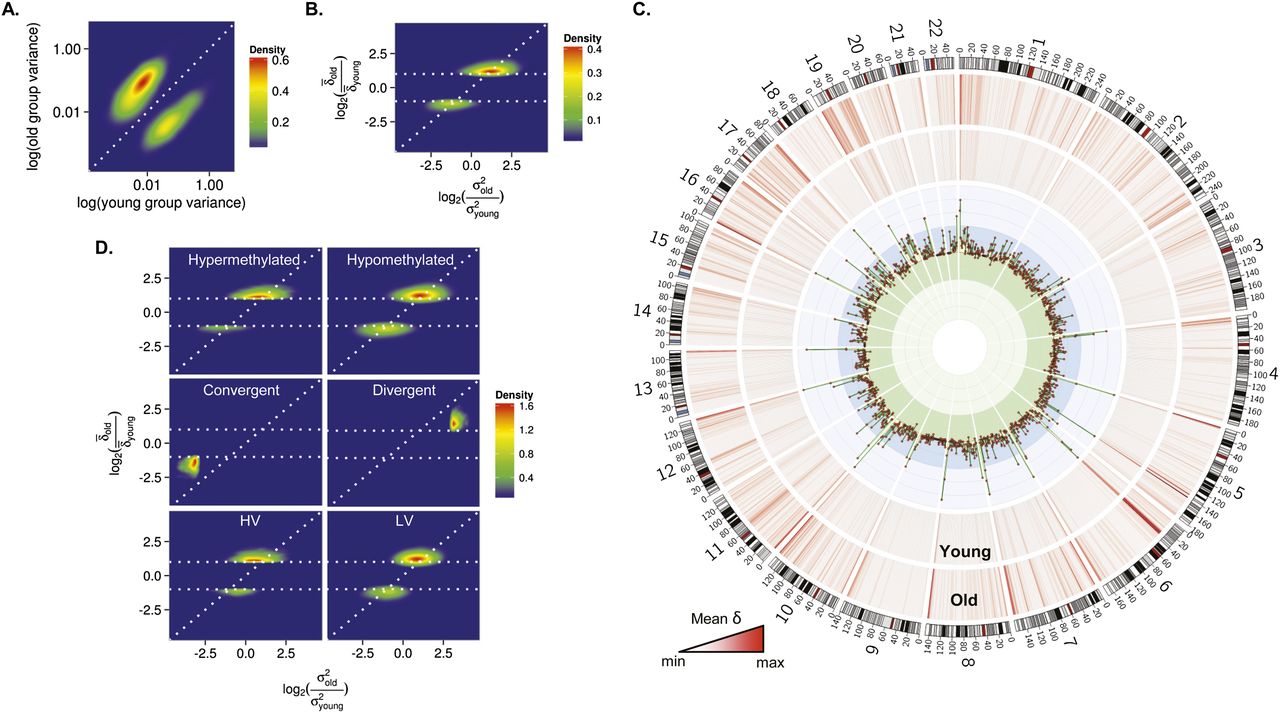
Role of genetic factors in interindividual DNA methylation variability during aging. (A) Density plot for CpG sites showing significant changes of methylation variance in the blood cells of MZ twins during aging.
(B) Density plot for comparison between the mean Euclidean distance (δ) and the interindividual variability (σ2) in methylation values between old and young MZ twins. The horizontal dotted lines represent a twofold change in the δ between
MZ twins. (C) Circular representation of genome-wide CpG sites showing differences in the  between methylation values of young and old MZ twins. δ was averaged using a 2-Mbp window size. Inner tracks show genomic regions where the
  was higher (blue region) or lower (green region) in old compared with young MZ twins. (D) Density plots for comparison between the
  and the σ2 in methylation values between old and young MZ twins, in hypermethylated, hypomethylated, heteroscedastic, and homoscedastic
CpGs.
and the σ2 in methylation values between old and young MZ twins, in hypermethylated, hypomethylated, heteroscedastic, and homoscedastic
CpGs.


