
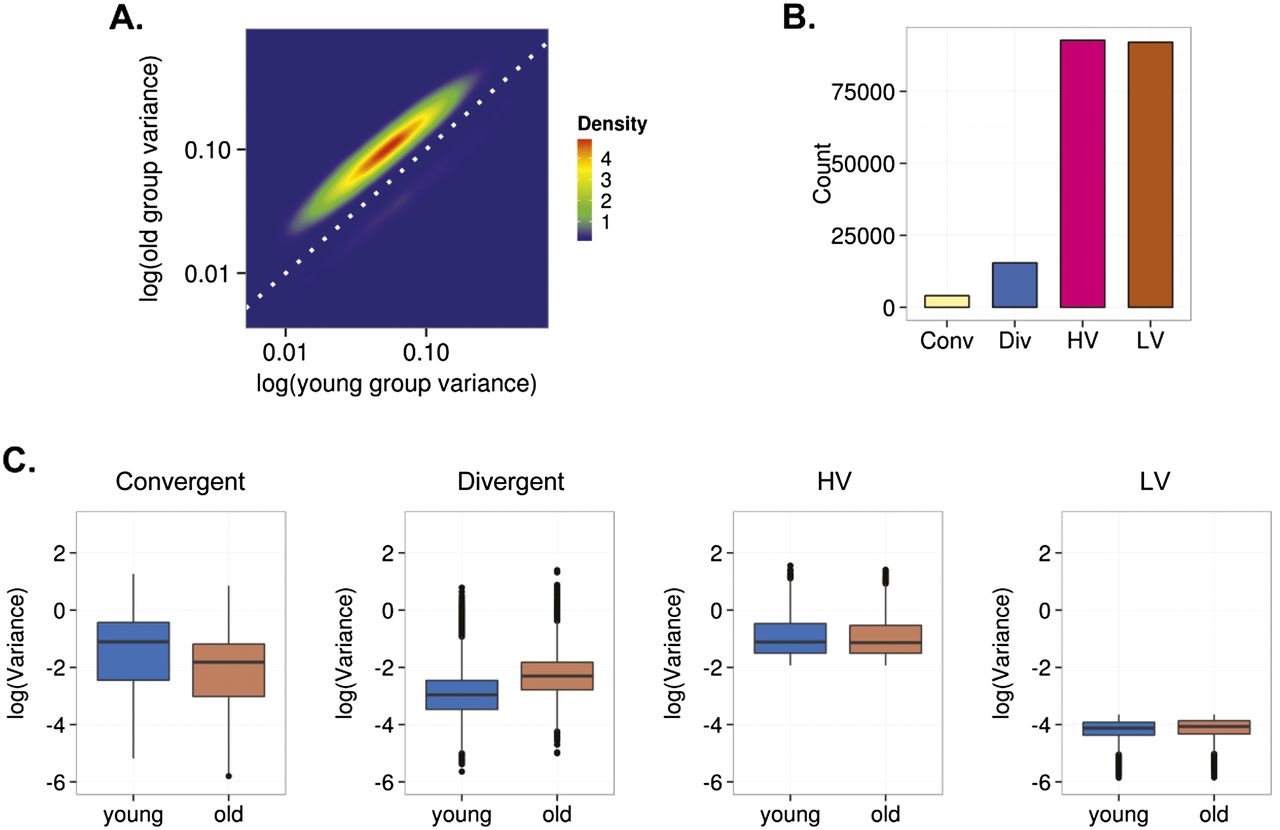
Figure 4.
Interindividual DNA methylation variability during aging of blood cells. (A) Density plot for CpG sites showing significant changes of variance in young and old individuals. (B) Bar plot showing the number of age-dependent heteroscedastic (convergent and divergent) and homoscedastic (high [HV] and low [LV] variability) CpG sites. (C) Box plots showing the classification of the CpG sites in different groups based on the aging-dependent behavior of the interindividual variability.


