
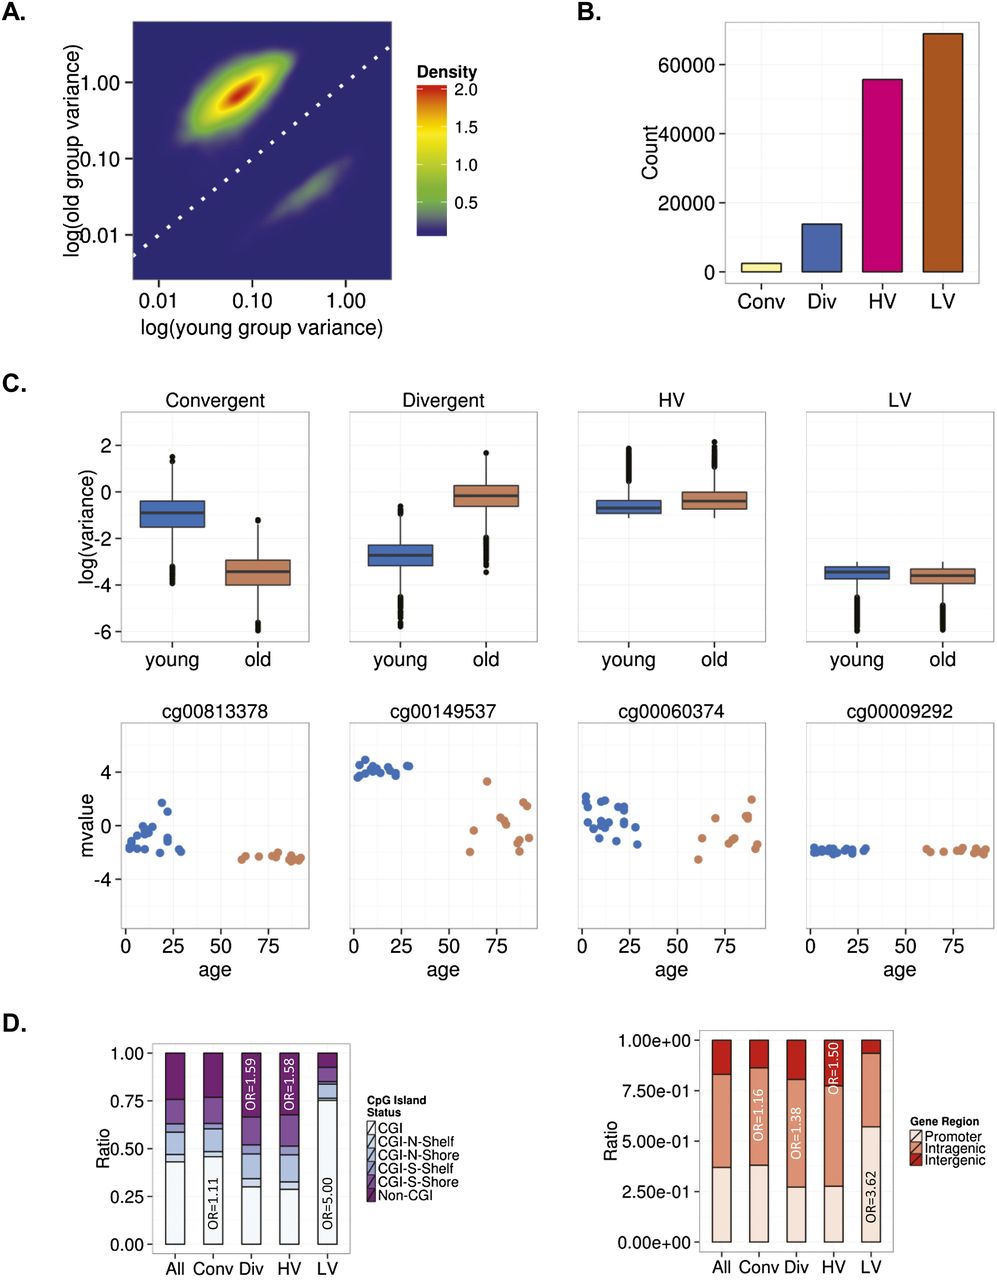
Interindividual DNA methylation variability during MSC aging. (A) Density plot for CpG sites showing significant changes in variance in young and old MSCs. (B) Bar plot showing the number of age-dependent heteroscedastic (convergent and divergent) and homoscedastic (high [HV] and low [LV] variability) CpG sites in MSCs. (C) Box plots showing the classification of CpG sites into different groups based on the aging-dependent behavior of the interindividual variability. Representative examples of CpG sites for each group are shown below (mvalue: relative methylation values). (D) Distribution of homoscedastic and heteroscedastic CpGs relative to CpG island status and relative distribution across different genomic regions.


