
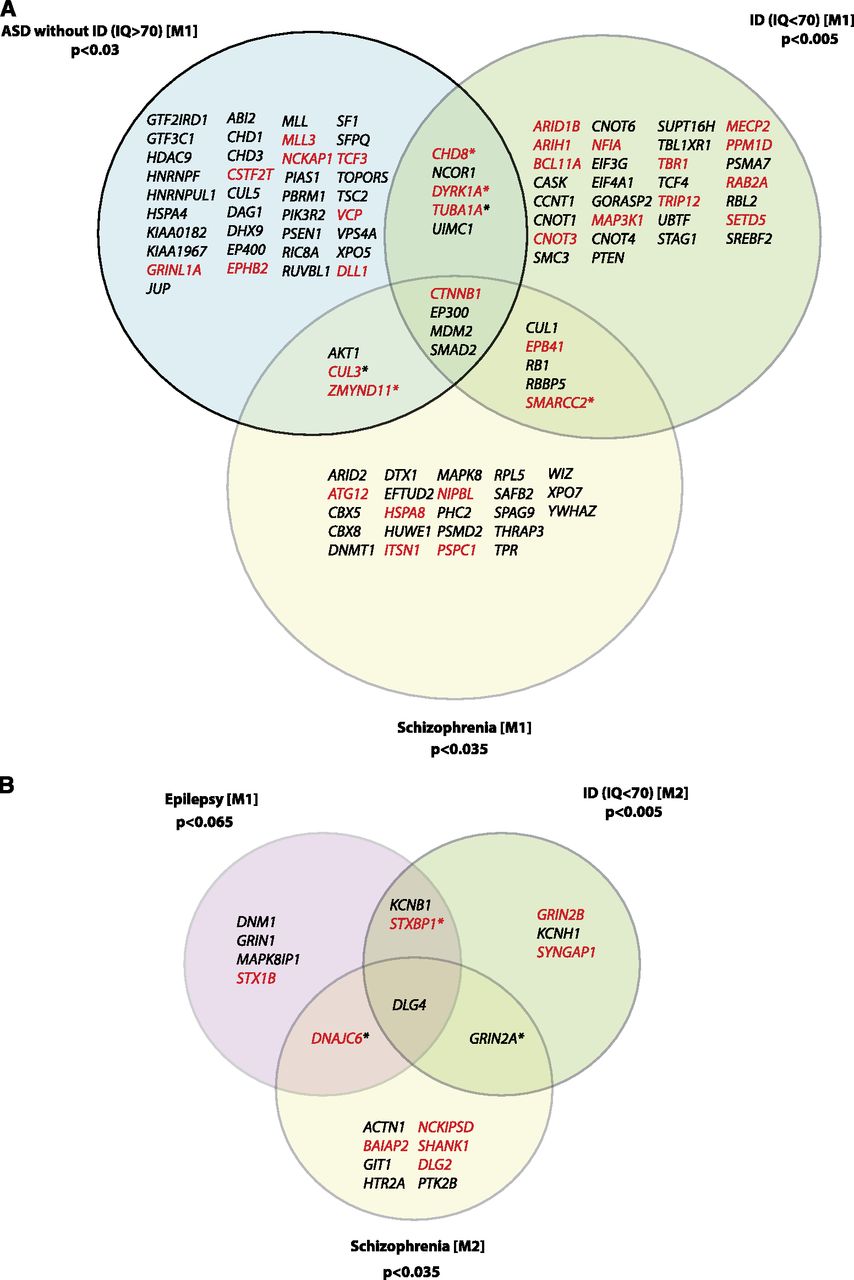
Overlap of the modules identified for different neurodevelopmental diseases. (A) Venn diagram representing the overlap between genes that carry de novo mutations and are detected as part of the first modules when analyzing ASD without ID (IQ ≥ 70), ID with or without reported ASD (IQ < 70), and schizophrenia. Genes with LoF mutations are colored in red. Genes with only missense mutations are colored in black. Asterisks indicate genes for which mutations have been observed in two different groups. (B) Venn diagram representing the overlap between genes that carry de novo mutations and are detected as part of the second module of ID, the second module of schizophrenia, and the first module of epilepsy. The P-value reported for each disease is the maximum P-value of the three null models.


