
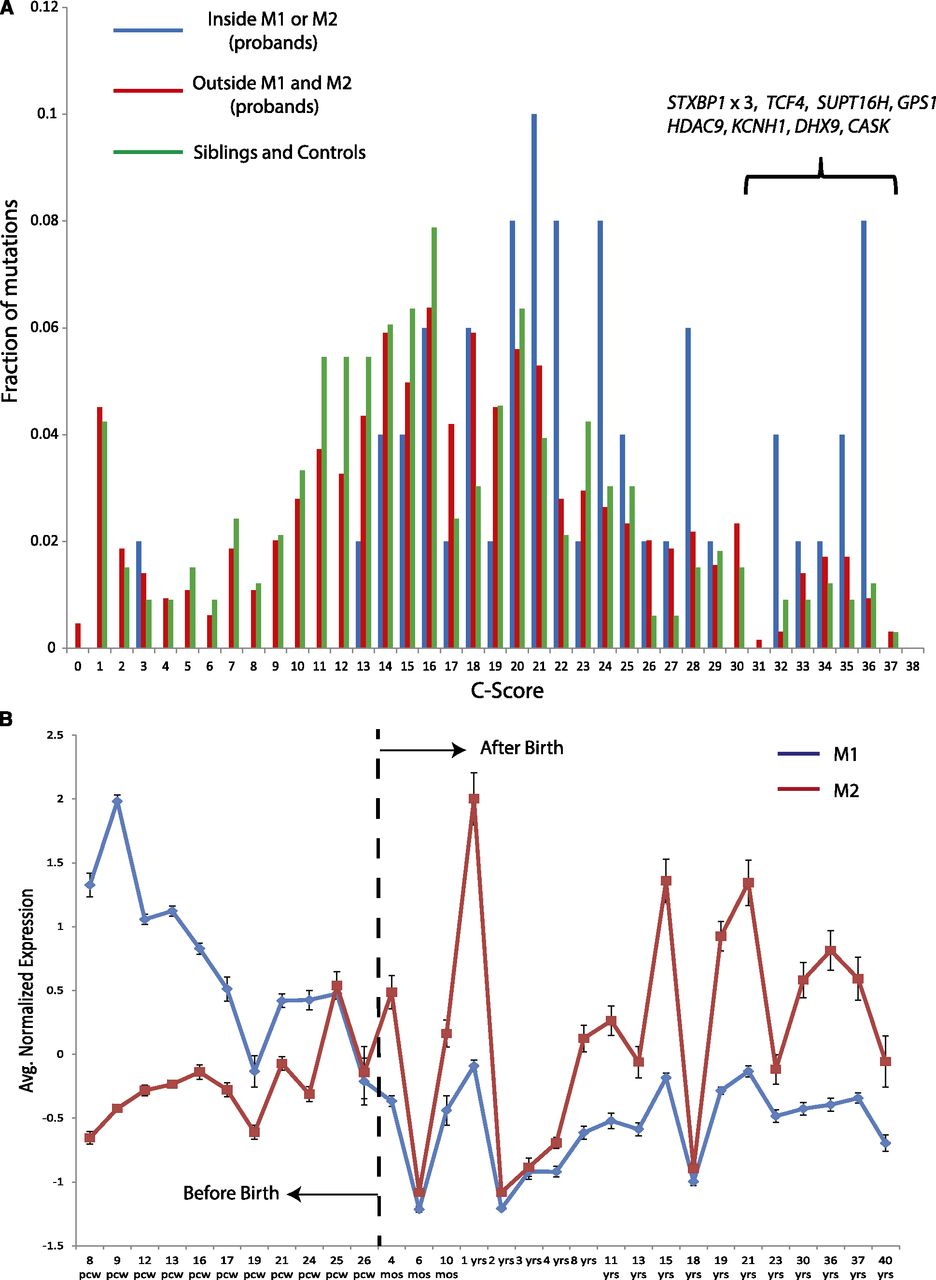
Figure 4.
Severity of missense mutations and differences in temporal patterns of expression. (A) The distribution of C-scores of probands’ missense mutations found inside M1_Extended or M2_Extended, outside M1_Extended and M2_Extended, and siblings' and controls' missense mutations. (B) Average normalized expression of all brain subtissues for M1_Extended and M2_Extended during brain development. Error bars represent mean ± SEM.


