
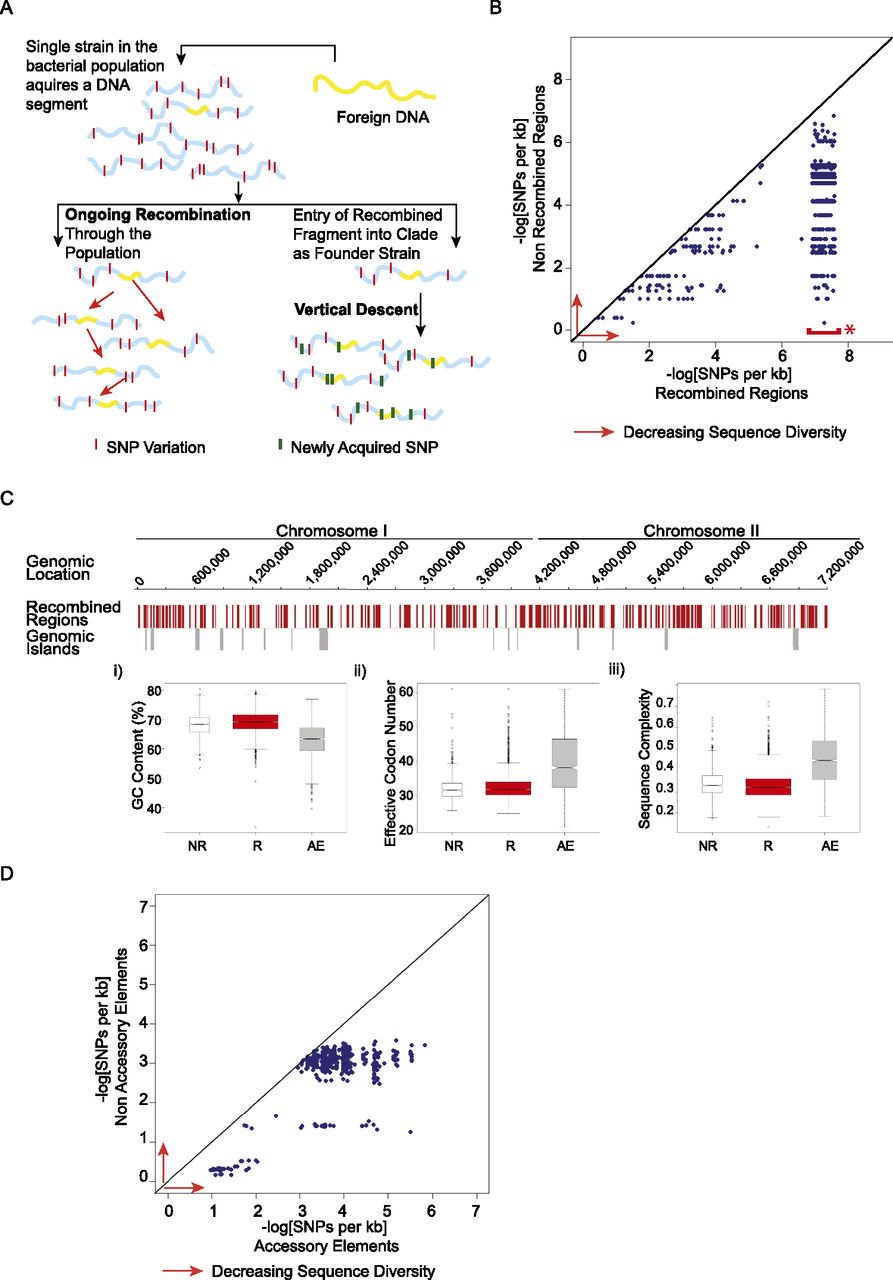
Distinguishing between ongoing recombination and vertical descent and in Bp. (A) Alternative models for clade-specific recombination haplotypes. (Left) In the “Ongoing Recombination” model, an imported fragment sweeps through the population via recombination, resulting in homogenization of the recombining fragment across strains. The recombining fragment should show lower levels of sequence diversity compared to nonimported regions. (Right) In the “Vertical Descent” model, an ancestral strain acquires a genomic fragment (yellow) from an external strain and subsequently transmits that fragment to all daughter strains in a clonal fashion. In this model, the imported fragment should accumulate new point mutations (green bars) at a similar rate to nonimported regions. (B) Within-clade sequence diversity of recombined regions compared to nonrecombined regions. Scatter plots comparing within-clade sequence diversity values of individual recombined regions (x-axis) to nonrecombined regions (y-axis) for the same strains in a given clade. Sequence diversity decreases in the direction of the red arrows (to right and upward). (*) Data points highlighted by the red bar correspond to recombined regions exhibiting 100% sequence identity. To visualize these points in a manner that captures both their density and extremely low sequence diversity, these were plotted within the x-axis range of 6.9–7.6 on a negative log scale. Sequence diversity is defined as the number of SNPs per kb. (C) Sequence features of nonrecombined regions (NR), recombined regions (R), and accessory elements (AE). (Top) Bp K96243 genomic tracks of Chr I and Chr II. Row 1: Genomic locations of recombined regions (red). Row 2: Genomic locations of 16 known Bp genomic islands (gray). (Bottom) Sequence feature comparison of genes in nonrecombined (white; NR), recombined (red; R), and accessory elements (gray; AE): (i) GC content (Puigbò et al. 2008); (ii) effective codon number (Puigbò et al. 2008); and (iii) sequence complexity (Pietrokovski et al. 1990). Each hourglass plot spans the 25th to 75th percentile (interquartile range [IQR]) of all genes in that category, with the bottleneck at the median. Horizontal tick marks show data ranges within 1.5 × IQR of the 25th and 75th percentiles. Open circles represent outliers outside this range. The width of the bottleneck (i.e., the length of the V-shaped notch) depicts the 95% confidence interval for the median. (D) Within-clade sequence diversity of accessory elements compared to nonaccessory elements. Accessory elements are defined as regions not present in the BpK96243 reference strain (see Methods). Scatter plots compare average sequence diversity values for individual accessory elements (x-axis) to corresponding nonaccessory elements (y-axis) for the same strain pairs in a given clade. Sequence diversity is defined as the number of SNPs per kb.


