
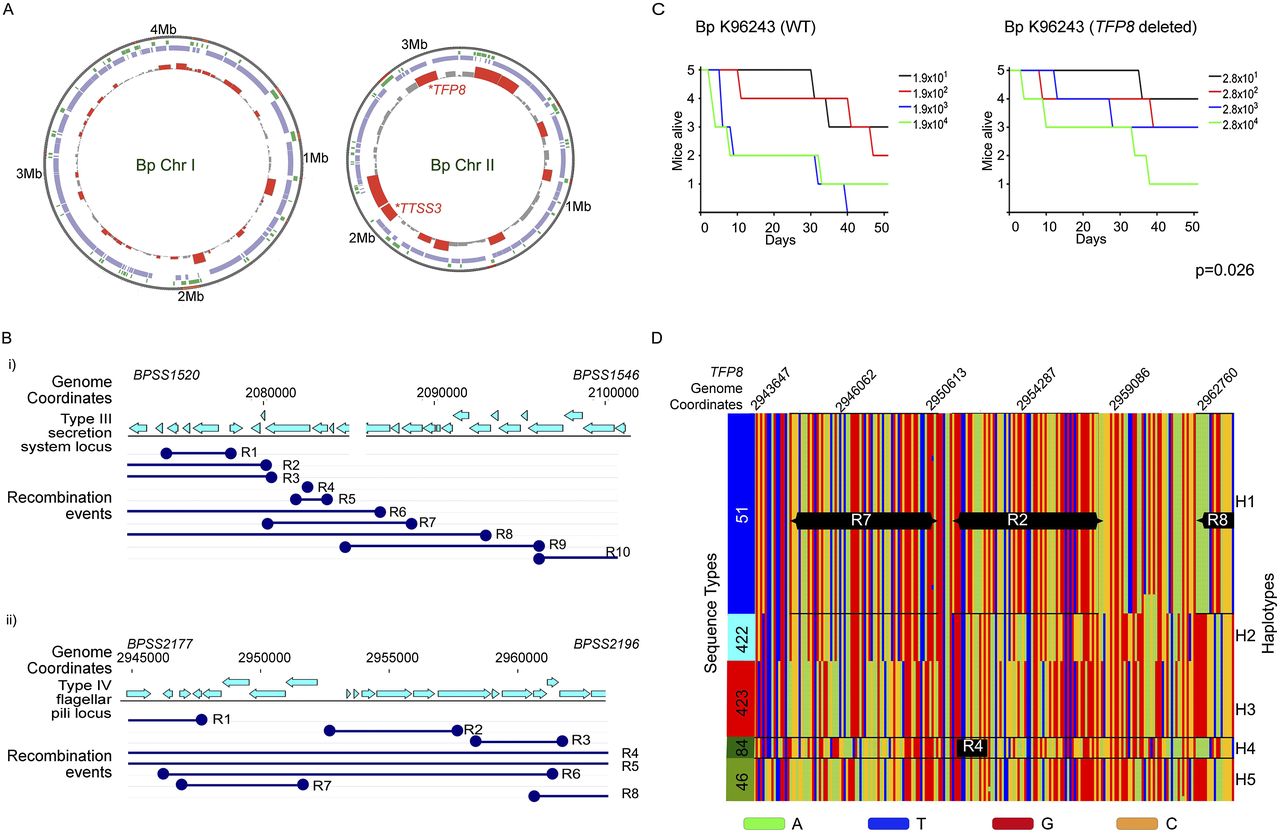
Recombination landscape of Bp. (A) Recombination hotspots in Bp. Circles: (outside) genome coordinates; (middle) compositionally biased regions identified by Alien hunter (Vernikos and Parkhill 2006) (green) and Bp core genome (violet); (innermost) regions of elevated recombination (height of red bars). Note that recombination levels are higher on Chr II than Chr I. Location of the TFP8 and TTSS3 clusters are indicated. (B) Local recombination events in the Type III secretion system and Type IVB pilus cluster. (Top) Genomic coordinates and location of protein-coding genes; (dark blue) predicted recombination events (R1 to Rn, n = number of recombination events) observed in Bp strains belonging to genomic clades (ST group 46, 51, 84, 289, 422, and 423). The recombination boundaries are indicated by the dark blue circles and the boundaries that fall beyond the depicted locus are shown as open ended. (C) Relative virulence of TFP8 deletion mutant. Graphs show survival curves of BALB/c mice following intranasal challenge with varying dosages of Bp (left: K96243 wild-type; right: TFP8 deletion mutant, units are colony forming units, CFU). See Methods for infection assay details. The TFP8 deletion mutant is significantly less virulent compared to Bp K96243 parental controls (P = 0.026, Mantel-Haenszel log rank test). (D) Distinct haplotypes at the TFP8 genomic locus. Each row represents an individual Bp strain arranged according to genomic clade/ST (shown on left with color bars indicating ST51 [blue]; ST422 [cyan]; ST423 [red]; ST84 [dark green]; and ST46 [light green]). Across each row (strain), SNP positions are ordered by genomic coordinate (top numbers, Bp Chr II, genomic locus 2,935,860–2,976,718), and color-coded according to nucleotide identity (A→ green; T→ blue; C→ orange; and G→ red). The right y-axis “Haplotypes” refers to the specific linear combination of SNPs exhibited by individual strains. In some cases, haplotypes can be composed of a specific combination of smaller recombination regions (R). For example, Haplotype H1 is composed of recombination regions R2, R7, and R8. Haplotype alignments were generated using Clustal X (Larkin et al. 2007).


