
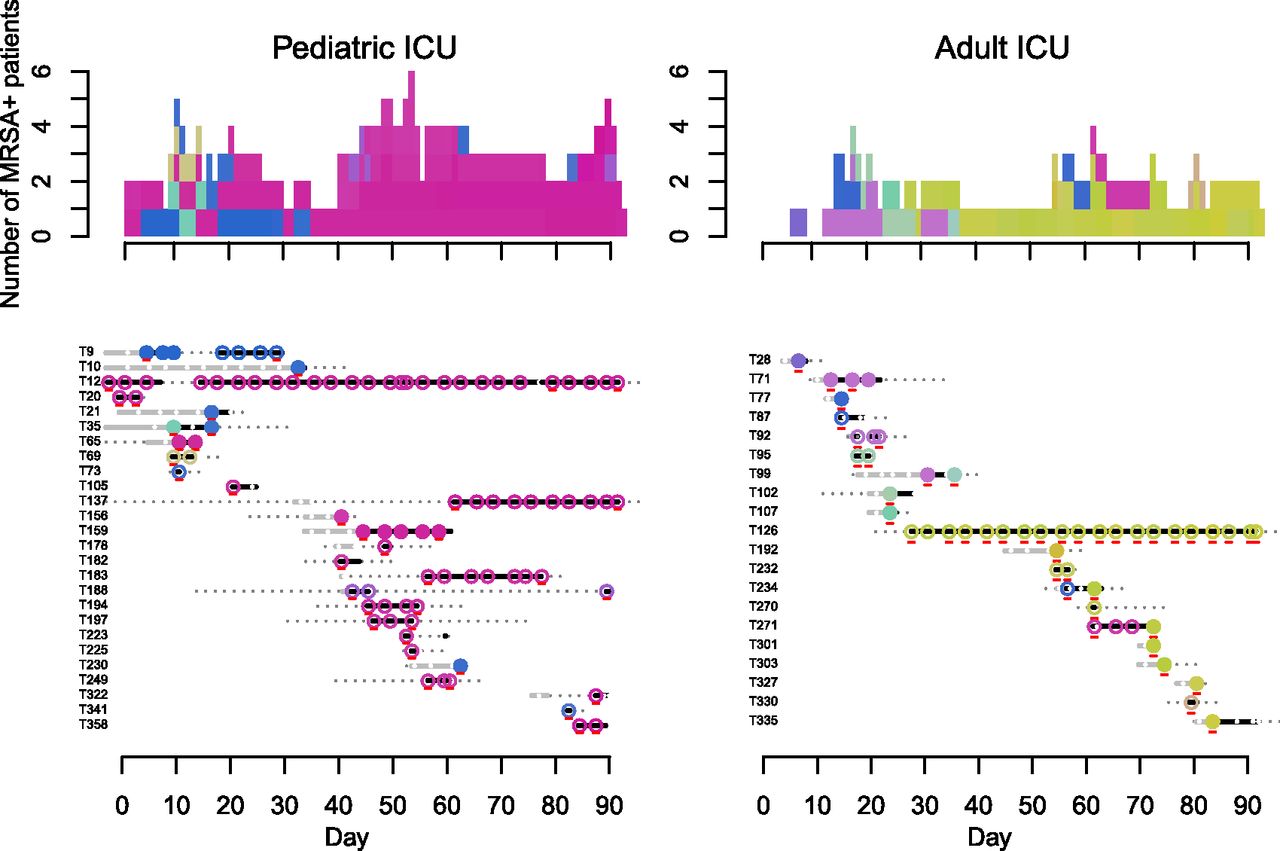
Dynamics of MRSA clades on the pediatric (left) and adult (right) ICUs. (Bottom) Each row provides details of a study patient (T number). Duration of admission to the hospital is shown in days, with a solid line for period(s) in the ICU ([gray] MRSA negative; [black] MRSA positive), and a dotted line for inpatient periods outside the study ICUs (MRSA status not tested). Superimposed on the lines are dots and circles ([white dot] MRSA negative; [colored circles] MRSA positive). An open colored circle signifies that the MRSA isolate was cultured from the first swab taken following ICU admission and was most likely acquired elsewhere in the hospital. A closed colored circle signifies that the MRSA isolate was cultured from a patient who had an initial negative MRSA screen in the ICU followed at a later time point by a positive one, which was interpreted as MRSA acquisition in the ICU. Colors were assigned based on the most recently sequenced isolate from the same patient and chosen to reflect sequence diversity. Each sequence was mapped to a unique color so that similar sequences have similar colors (see Methods). Representatives of the five clade colors used in Figure 1 are T35_N4 (clade 1, blue); T71_N3 (clade 2, purple); T106_N3 (clade 3, pink); T95_N1 (clade 4, green); and T126_N13 (clade 5, khaki). Isolates that were sequenced are underlined in red. (Top) The daily cumulative count of MRSA positive patients over the 3-mo study period. The colors used match the colored dots for MRSA isolates.


