
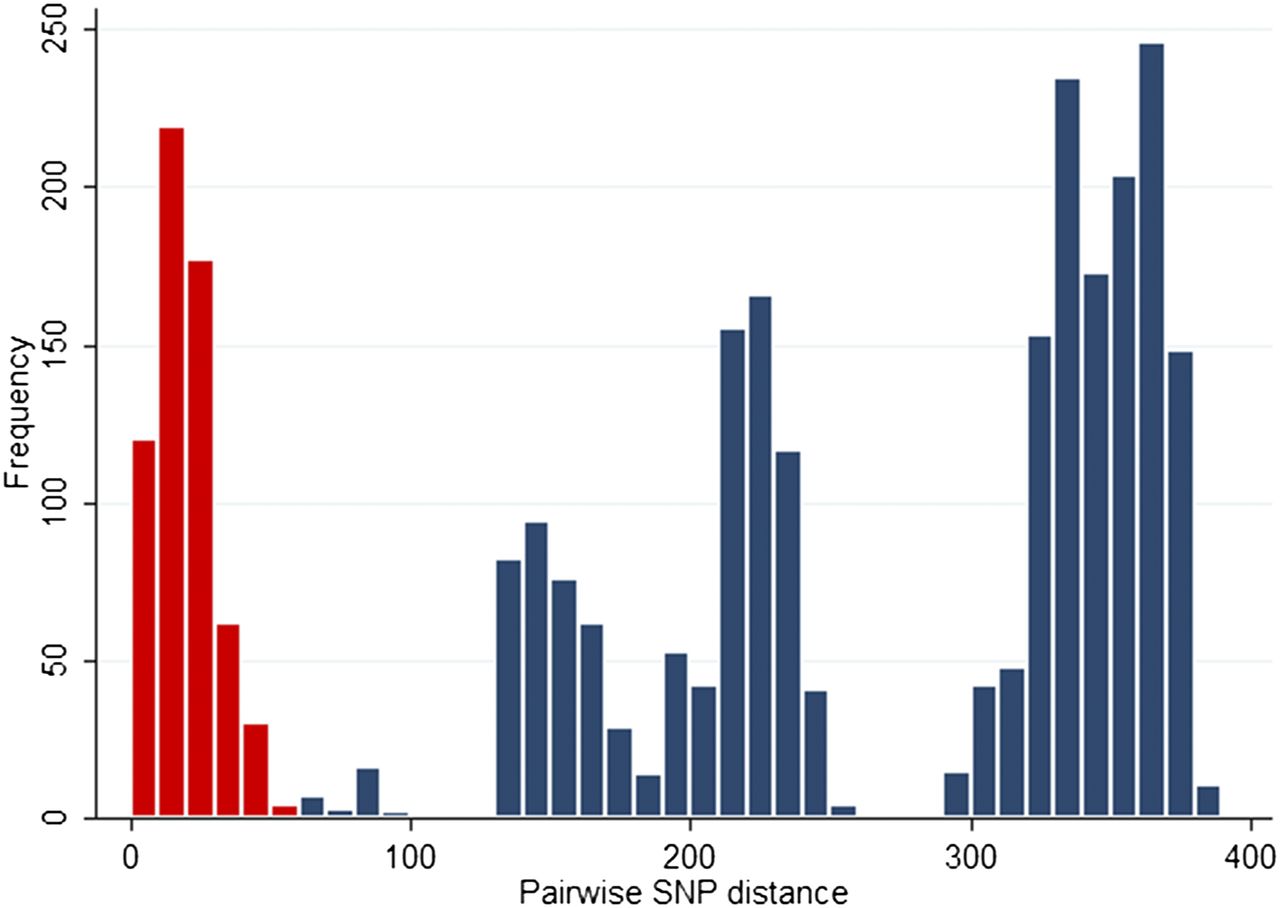
Figure 2.
Histogram of pairwise SNP differences between 76 isolates from 46 patients and five healthcare workers. SNPs differences between isolates from the same clade are represented in red, and between isolates in different clades in blue.


