
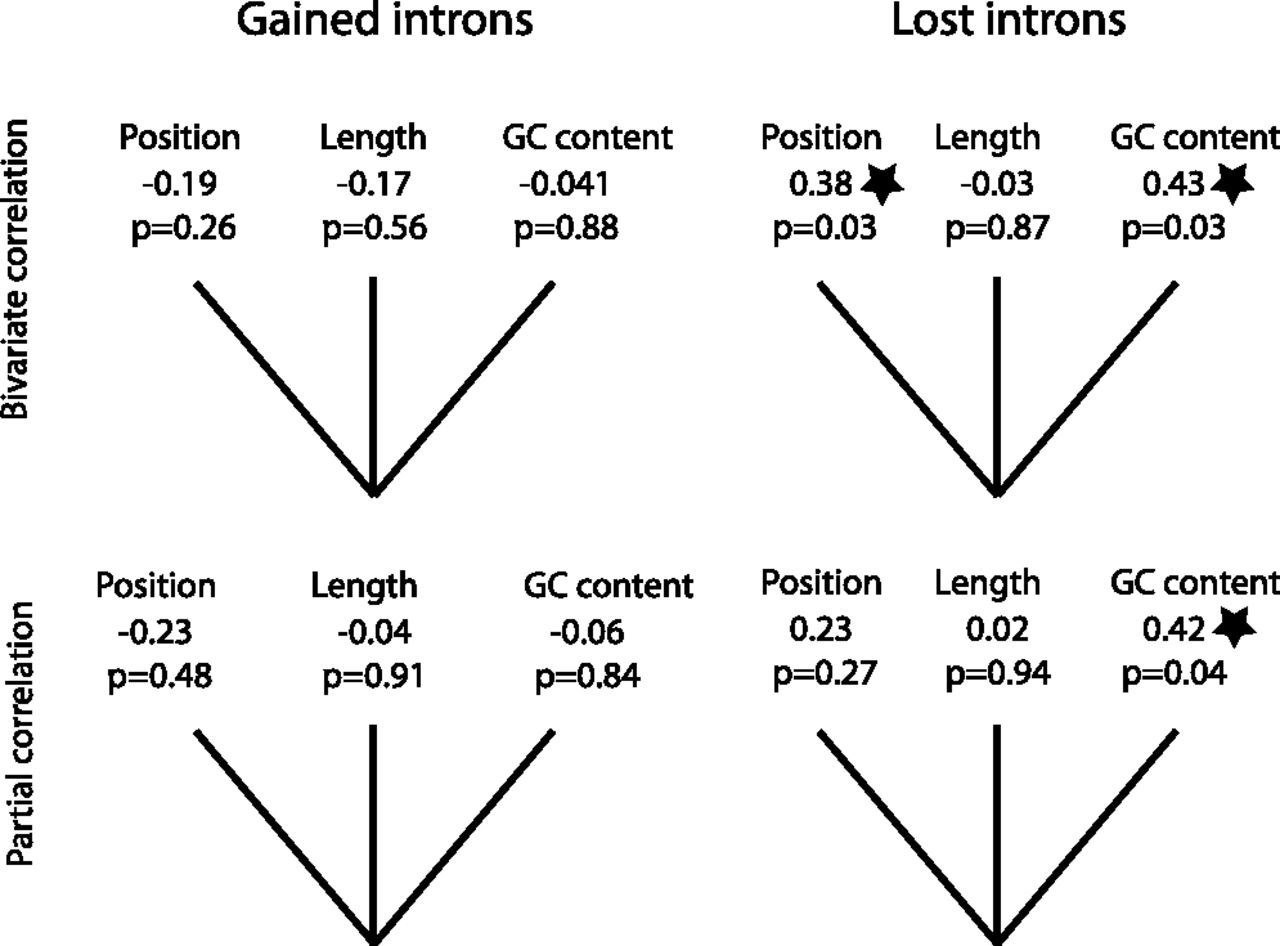
Figure 8.
Bivariate and partial correlation test between intron population frequency and intron position, length, and GC content for gained and lost introns. The correlation coefficient and P-value are listed below each category. Tests with statistically significant results are marked with stars.


