
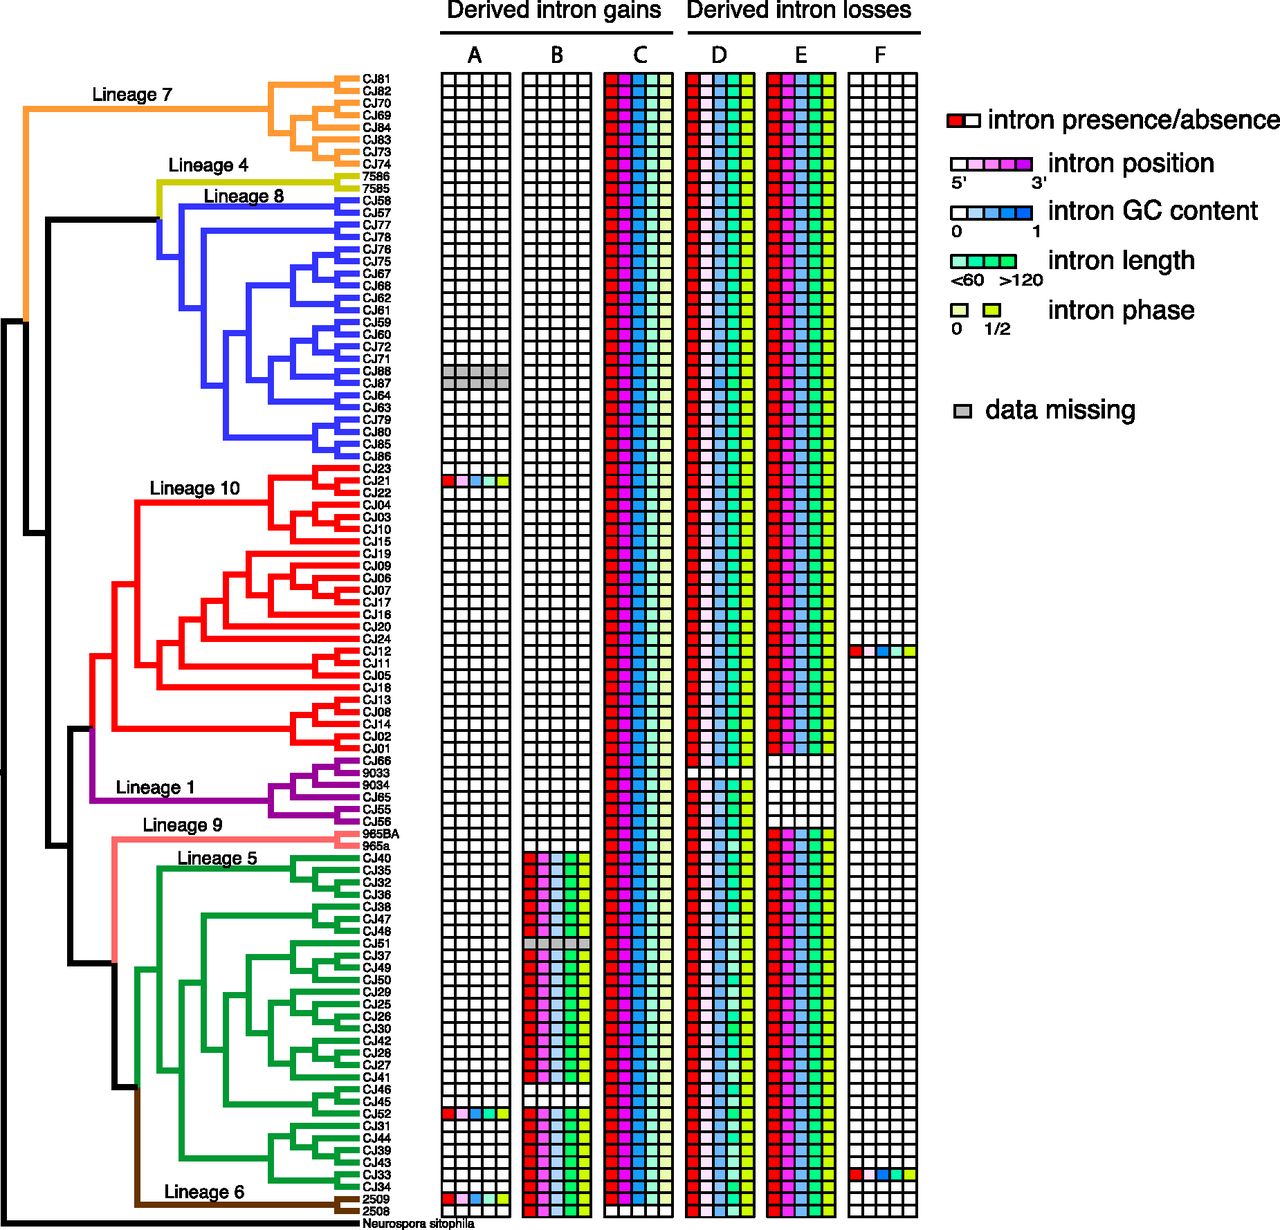
Examples illustrating intron polymorphic data in N. tetrasperma populations. Phylogenetic tree for N. tetrasperma populations is presented in the left panel, and branches for different lineages are shown with different colors. Six intron polymorphisms are chosen to represent (A) intron gain with low frequency, (B) intron gain within lineages, (C) intron gain with high frequency, (D) intron loss with low frequency, (E) intron loss within lineages, and (F) intron loss with high frequency. For each intron data set, the first column indicates intron present (red) or absent (white), and the second to fifth columns indicate intron position (magenta), intron GC content (blue), intron length (green), and intron phase (yellow). Gray indicates data missing.


