
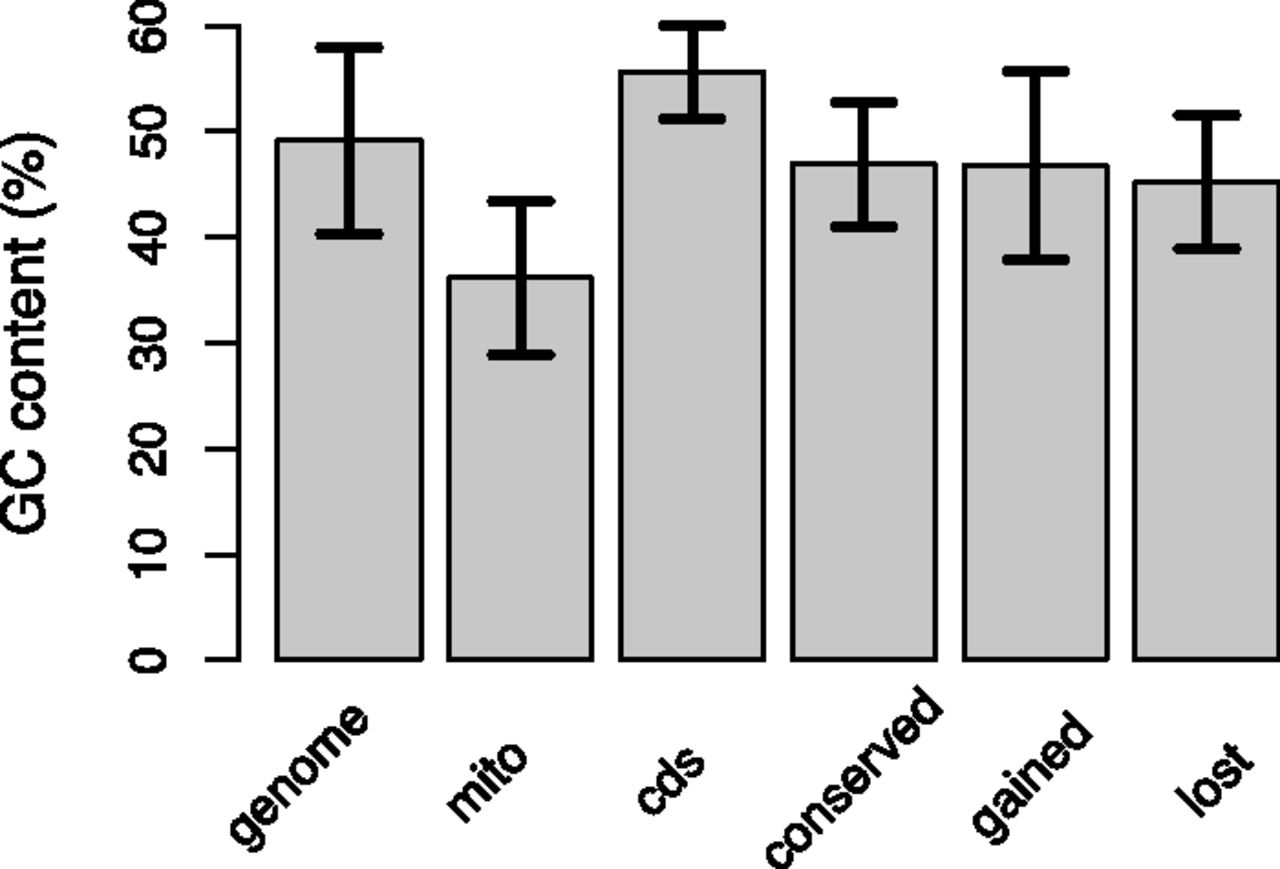
Figure 5.
GC content for the nuclear genome, the mitochondrial genome, all pooled coding sequences (CDS), and for conserved, gained, and lost introns, from left to right. Standard error is plotted on each bar.
(Downloading may take up to 30 seconds. If the slide opens in your browser, select File -> Save As to save it.)
Click on image to view larger version.
GC content for the nuclear genome, the mitochondrial genome, all pooled coding sequences (CDS), and for conserved, gained, and lost introns, from left to right. Standard error is plotted on each bar.
 CiteULike
 Delicious
 Digg
Digg Facebook
 Google+
 Reddit
 Twitter
