
Figure 4.
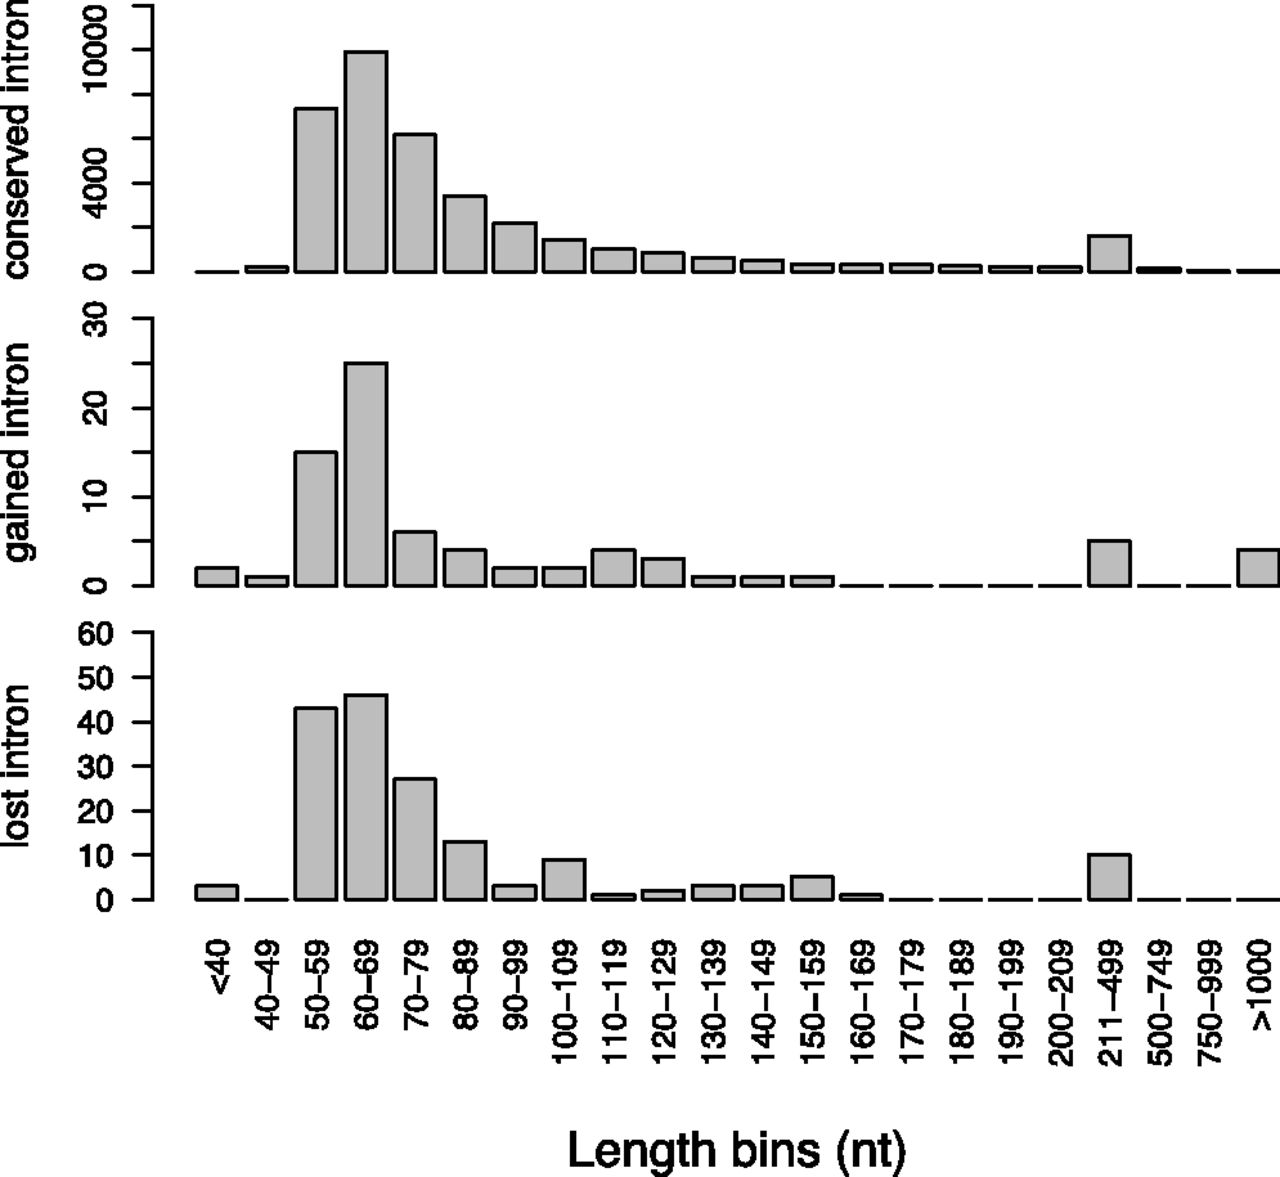
Intron length distribution for the conserved, gained, and lost introns. The binned intron lengths are shown on the x-axes and number of introns on the y-axes.
(Downloading may take up to 30 seconds. If the slide opens in your browser, select File -> Save As to save it.)
Click on image to view larger version.
Intron length distribution for the conserved, gained, and lost introns. The binned intron lengths are shown on the x-axes and number of introns on the y-axes.
 CiteULike
 Delicious
 Digg
Digg Facebook
 Google+
 Reddit
 Twitter
