
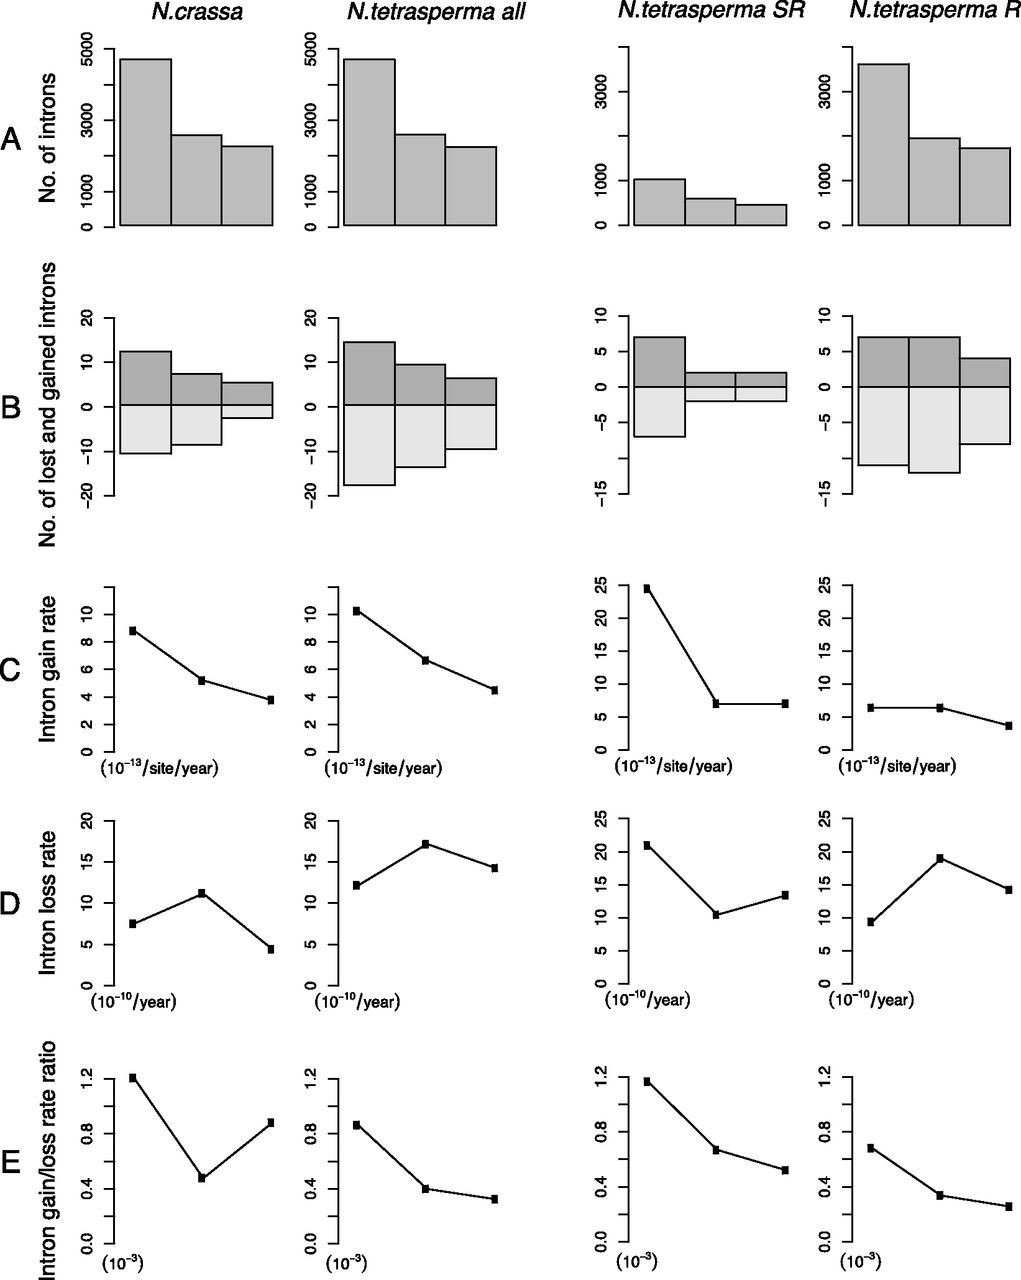
Positional biases of introns and their gains and losses in N. crassa and N. tetrasperma a. Introns are binned into three categories (5′, internal, and 3′) based on the intron position within a gene, with each category representing one-third of the coding sequence length. In each plot, the bar or point from left to right represents 5′, internal, and 3′ intron data. Data from N. crassa are presented in the left panel and N. tetrasperma is presented as all intron positions. (SR) Intron positions located within the suppressed recombination region of the mating-type chromosome, and (R) in the normal recombination region of the genome. (A) Number of introns. (B) Number of intron gains and losses since the last common ancestor of N. crassa and N. tetrasperma. Bars above the x-axis represent intron gain number, below, intron loss. (C) Intron gain rate. (D) Intron loss rate. (E) Intron gain/loss rate ratio.


