
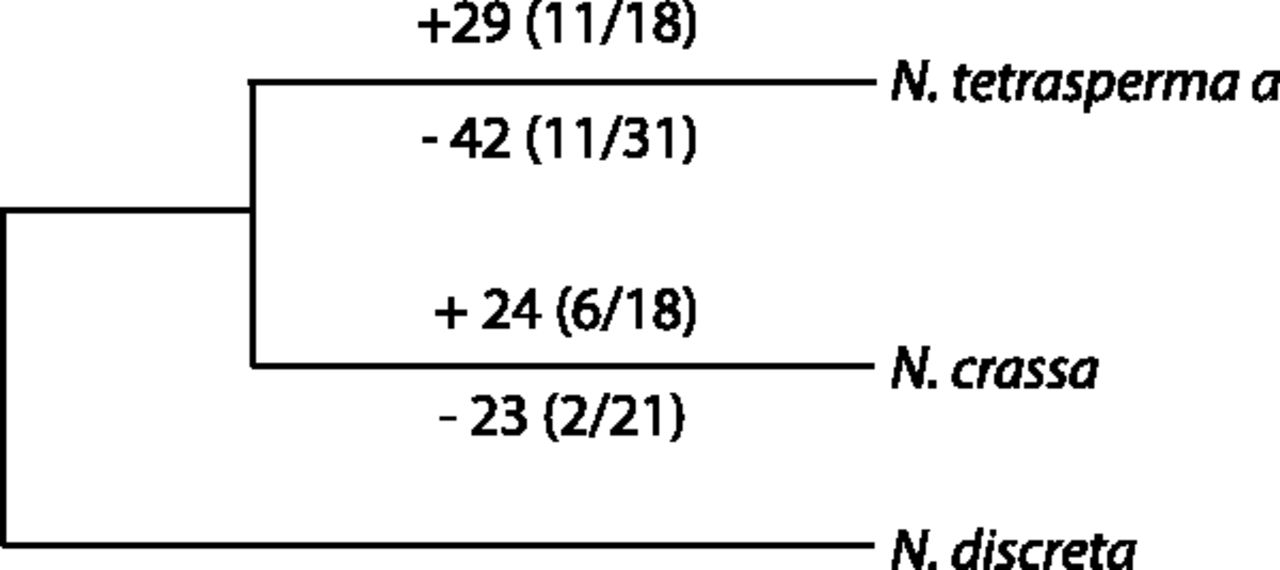
Figure 2.
Neurospora phylogenetic tree with numbers of intron gains and losses found at the branches delineating N. tetrasperma and N. crassa. Plus (+) indicates intron gain events, and minus (−) indicates losses. Numbers in parentheses indicate the number of the introns that are located within the region of suppressed recombination of the mating-type chromosome of N. tetrasperma (SR), and in the normal recombination region of the genome (R), as (SR/R). Note that in N. crassa, recombination is not suppressed in the SR region, but numbers are given for comparative purposes.


