
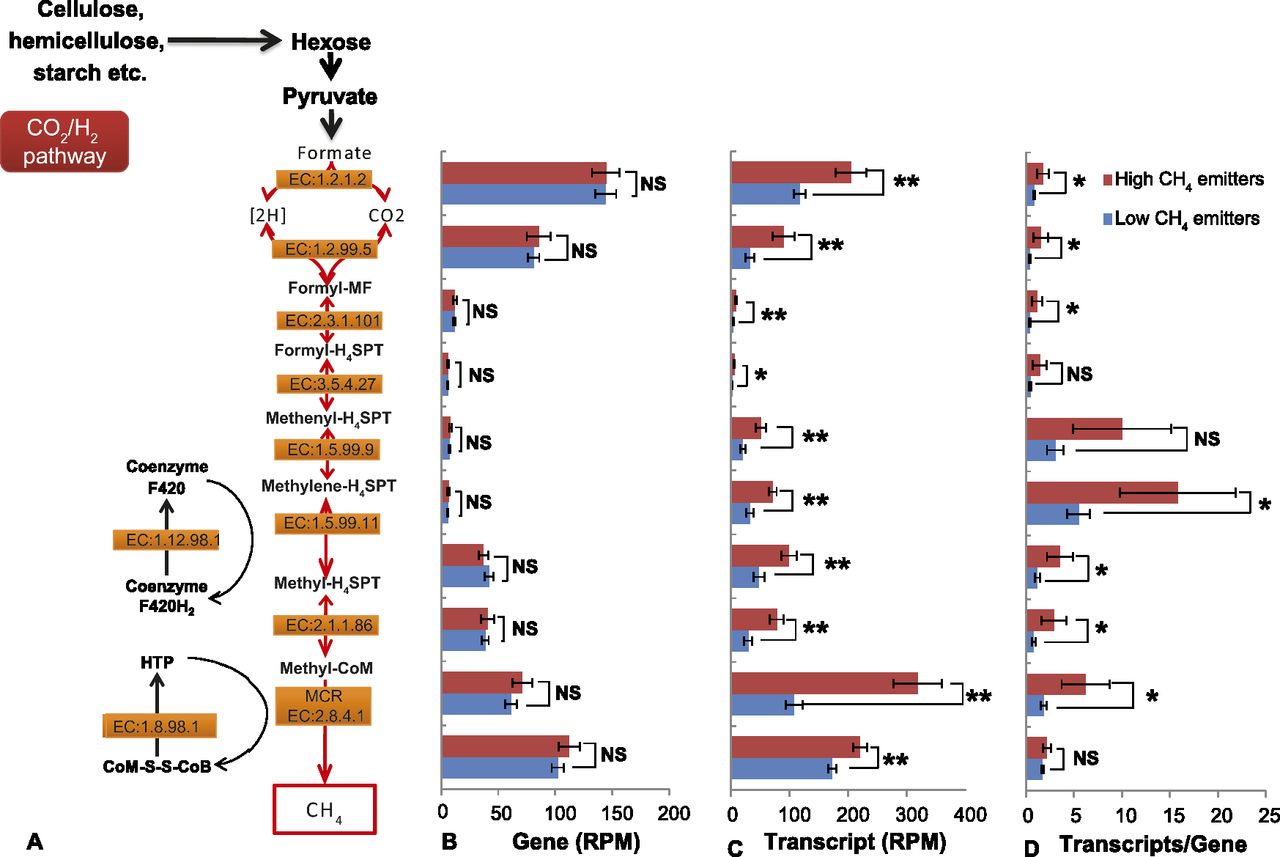
Figure 3.
Comparisons of gene and transcript abundance for enzymes involved in methanogenesis between high and low CH4 yield sheep. (A) Diagram of CO2/H2 methanogenesis pathway shows enzymes involved in each biochemical reaction. (B,C) Gene (B) and transcript (C) abundance for each enzyme. (D) Transcriptions per gene for each enzyme. (RPM) Reads per million; (NS) no statistical significance in Wilcoxon rank-sum test; (*) P < 0.05; (**) P < 0.01. Error bars, SE.


