
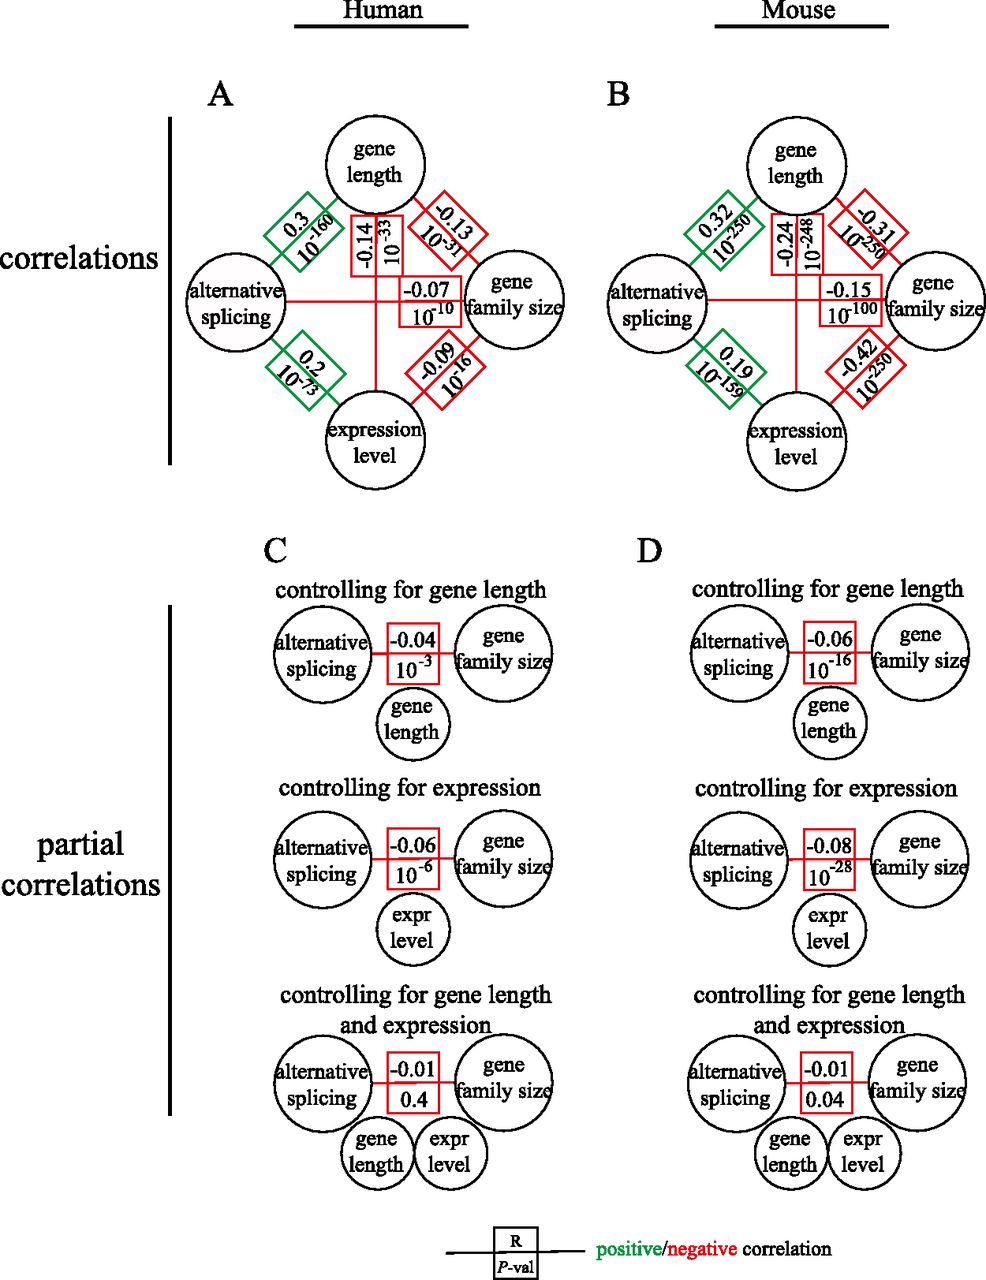
Figure 4.
The correlation between alternative splicing and gene duplication is diminished in both human and mouse when controlling for gene length and expression level. (A,B) Pairwise correlations between gene length, expression level, gene duplication, and alternative splicing in human (A) and mouse (B). Positive and negative correlations are indicated by green and red lines, respectively. The numbers above and below each line indicate the correlation coefficient and P-value of the significance, respectively. (C,D) Correlations between alternative splicing and gene duplication when controlling for gene length, expression level, and both, for human (C) and mouse (D).


