
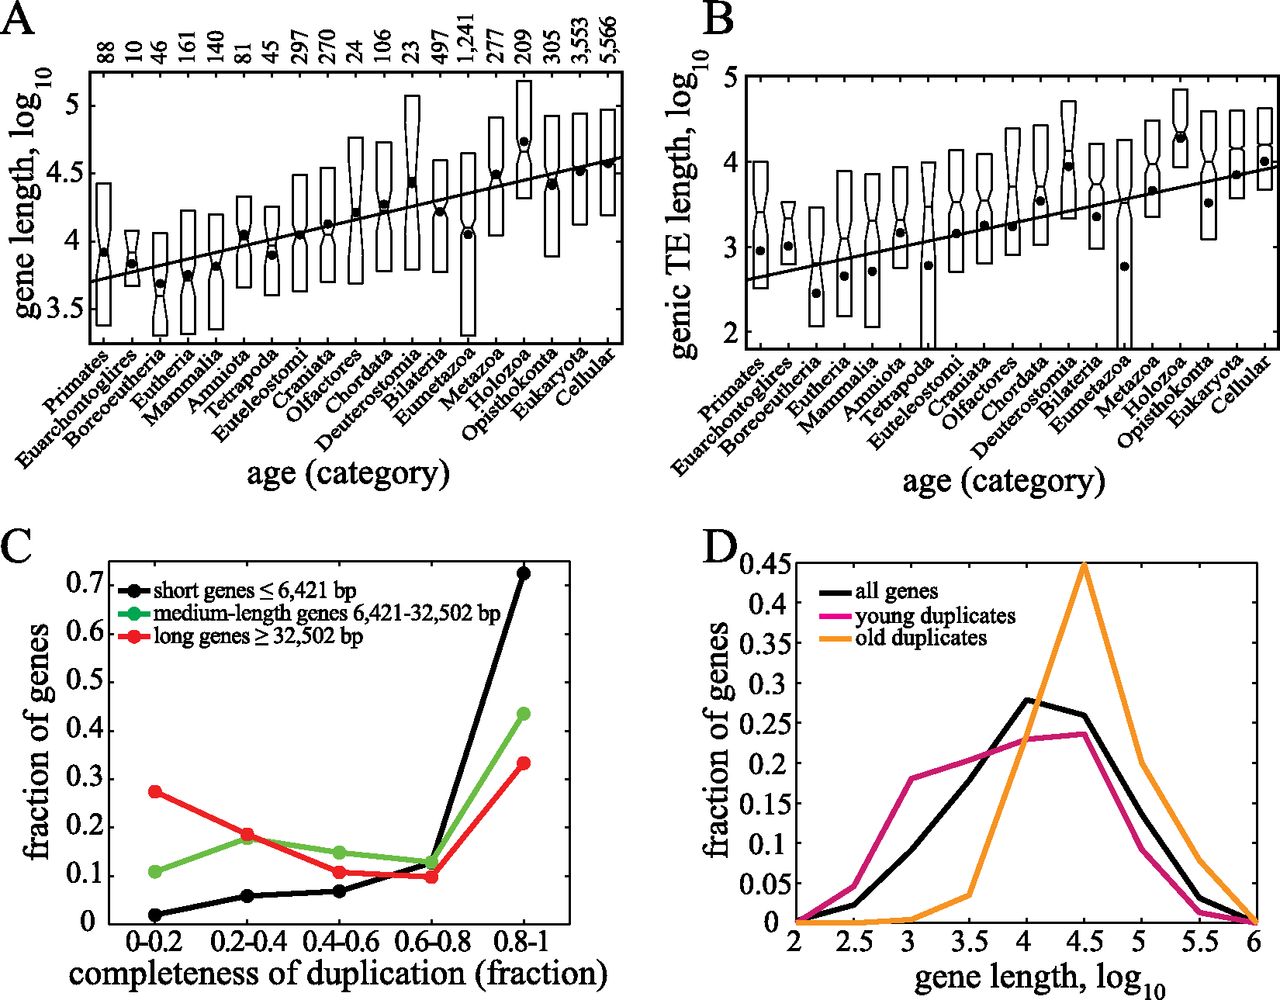
Dynamics of gene length in evolutionary time. (A) Gene length box plots for different gene age categories show that older genes are longer, suggesting that genes increase in length with time. The line is based on the least square fit of the mean. (B) The length of genic transposable elements also correlates with gene age (shown in the same format as A). (C) Truncation of gene lengths following incomplete gene duplication. Young duplicates (duplicated since separation of primates) of a family size of two were categorized into three equally sized gene length categories (short, medium, and long). The distributions show the ratio of the gene lengths of the paired duplicates (shorter gene length/longer). The set of the lengths of the longer genes in each pair was used to set the length categories. (D) Preferential duplications of shorter genes. The distributions of gene lengths for young duplicates (241 gene pairs), old duplicates (duplicated prior to the formation of Chordates, 234 gene pairs), and all human genes. The distribution is of the lengths of the longer gene of each pair.


