
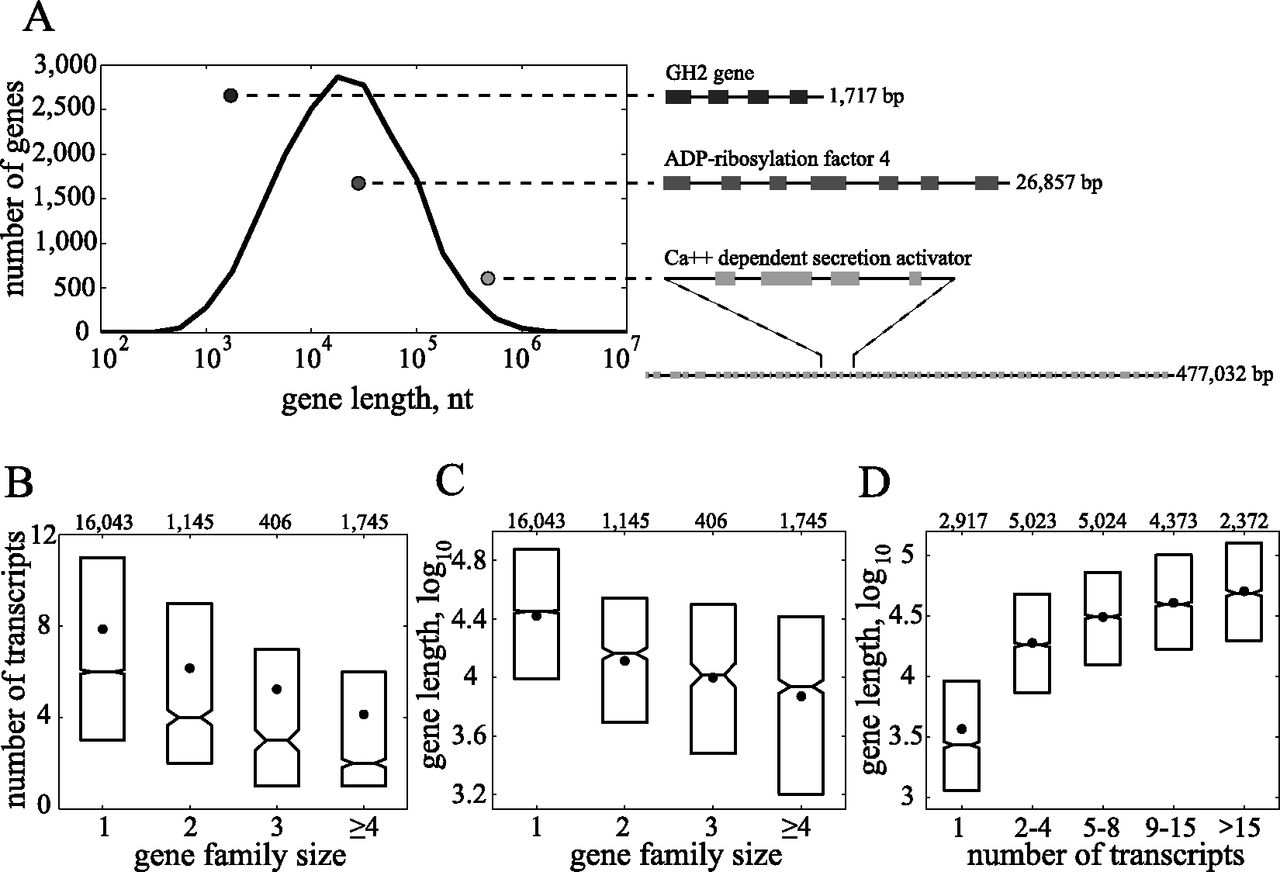
The correlation between gene duplication and alternative splicing is influenced by gene length. (A) Histogram of the lengths of human genes, computed as the number of transcribed bases, prior to splicing. Three particular genes are indicated as examples of short (black), medium (dark gray), and long (light gray) genes (boxes indicate exons). (B) An inverse relationship between a gene’s number of alternatively spliced variants and its family size, as previously characterized (Kopelman et al. 2005). The box plot indicates the median, mean (circle), and 25% and 75% quartiles. Above each box plot the number of genes in the set is shown. (C) Gene family size is negatively correlated with gene length. (D) The number of alternative transcripts is positively correlated with gene length.


