
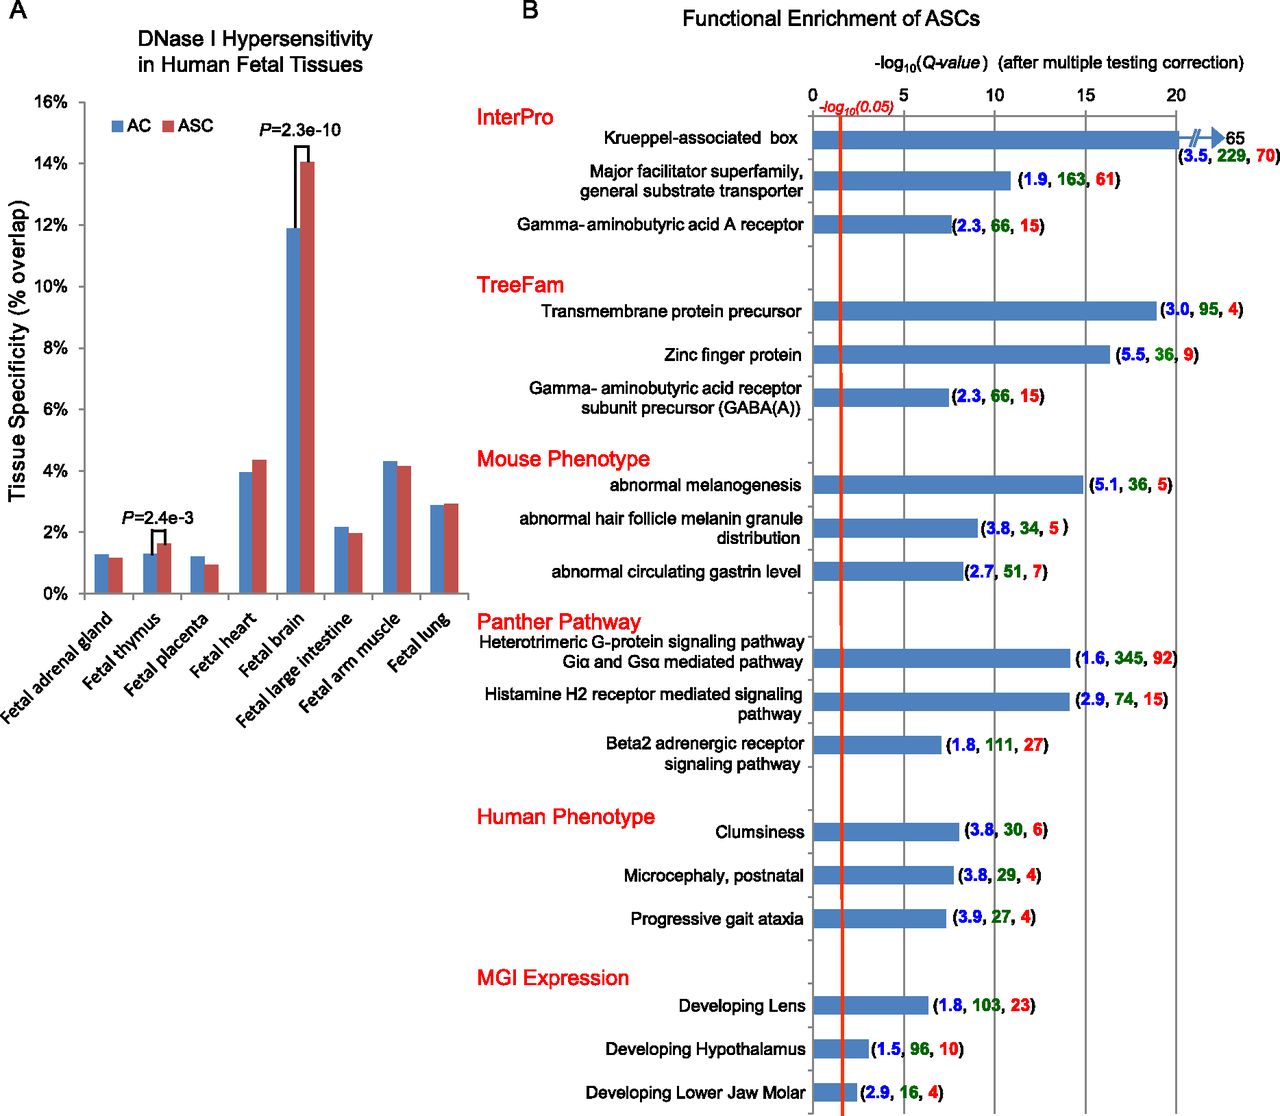
Figure 2.
Tissue specificity and functional enrichment of nonexonic ASCs. (A) Red and blue bars indicate the fraction of constrained base pairs overlapping tissue-specific DNase I hypersensitive sites. (B) Top three functional annotations within each ontology that are enriched near nonexonic ASCs (GREAT tool). Numbers indicate fold enrichment (blue), number of contributing ASCs (green), and number of annotated ASC-flanking genes (red).


