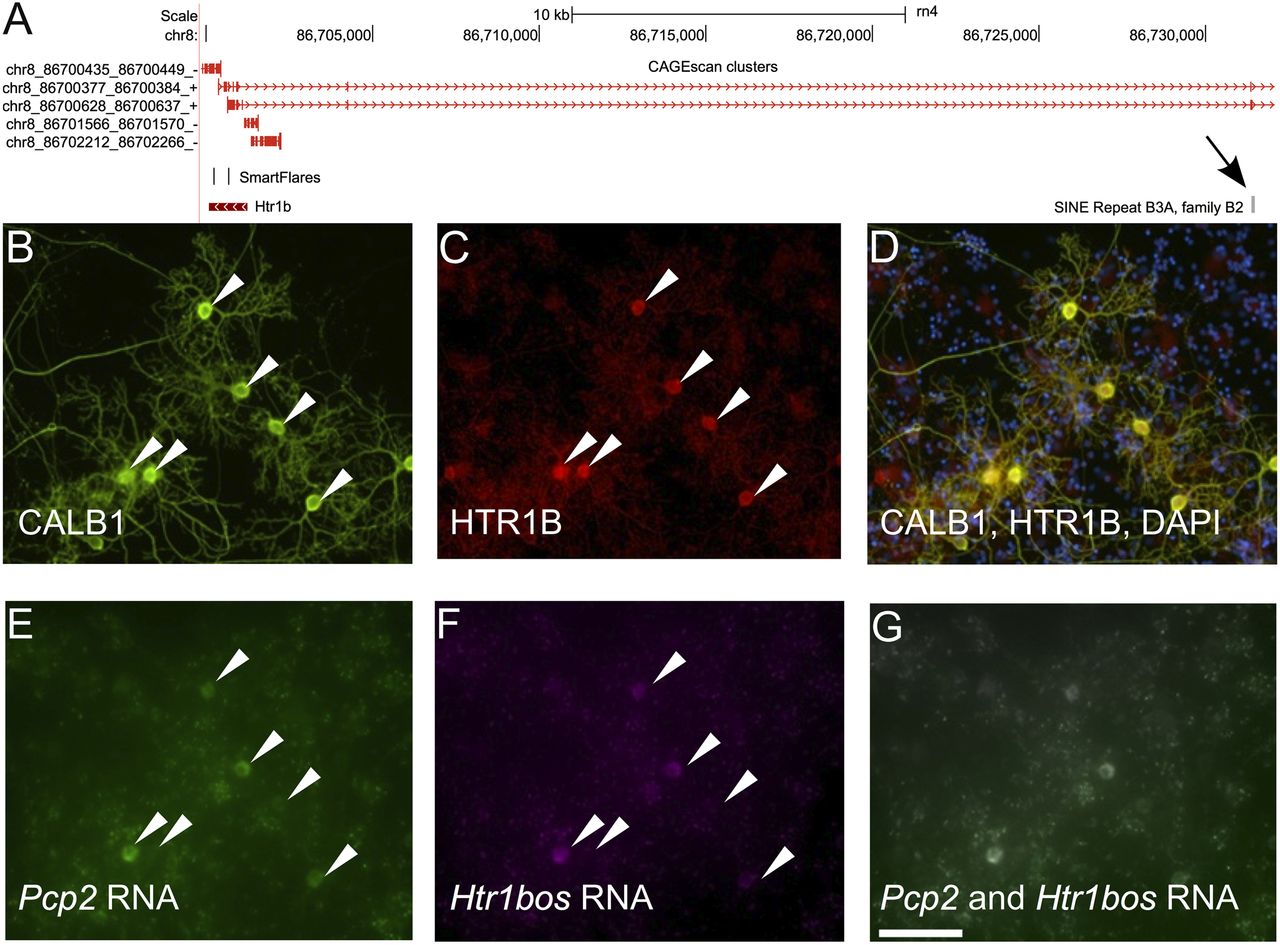
Digital expression profiling of the compartmentalized translatome of Purkinje neurons

(Downloading may take up to 30 seconds. If the slide opens in your browser, select File -> Save As to save it.)

Click on image to view larger version.

Figure 6.
Figure 6.

(A) Visualization of the Htr1b locus. (B–D) Immunofluorescence detection of CALB1 (B), HTR1B receptor (C), and combined immunofluorescence signals and DAPI staining (D). (E) SmartFlare Pcp2. (F) SmartFlare Htr1bos. (G) combined SmartFlare signals. Scale bar, 100 µm.

This Article

  1. Genome Res. 24: 1396-1410

Preprint Server