
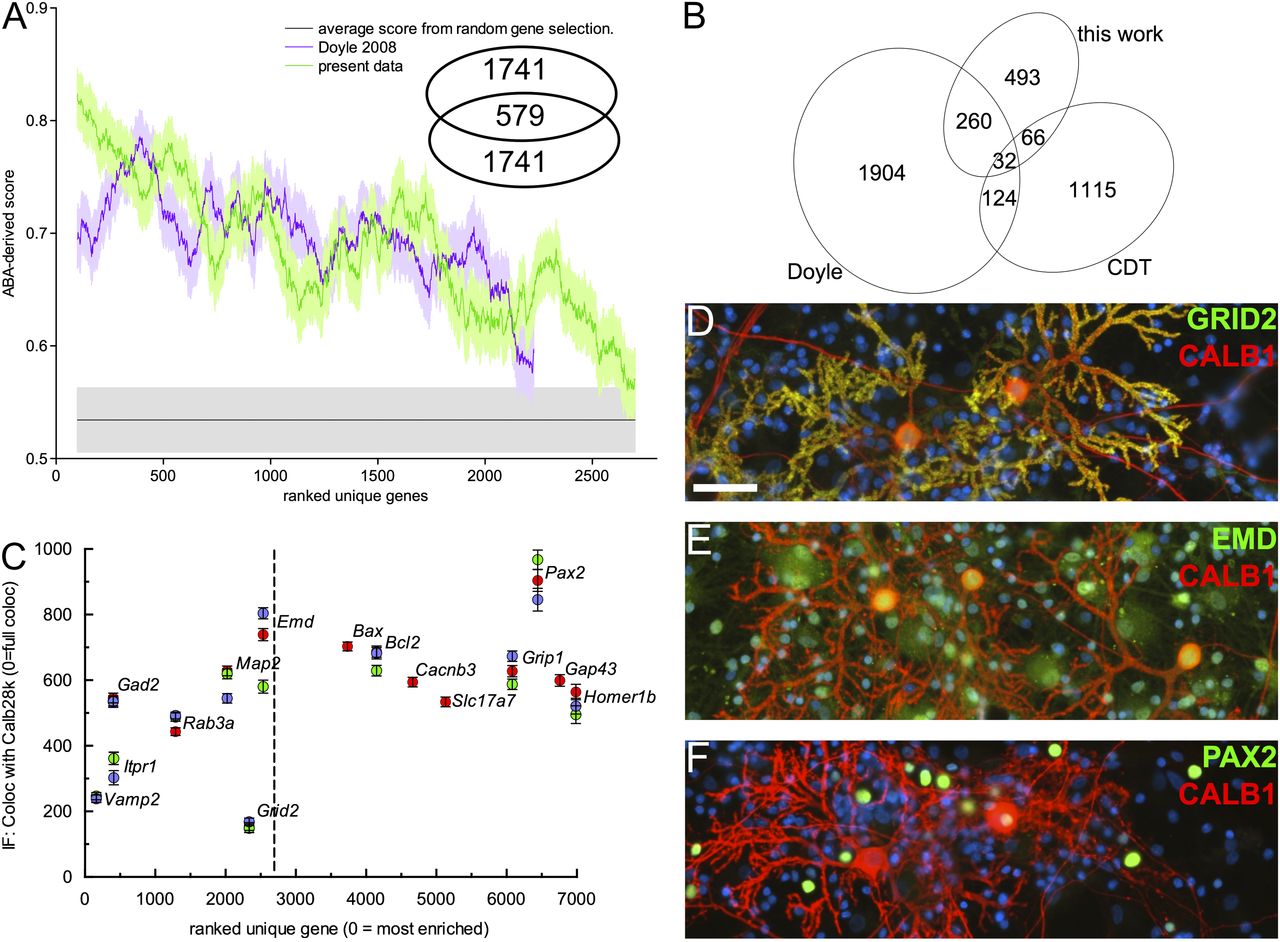
(A) Comparison of capture selectivity against a published data set and against noise. (X-axis) 200 points moving window (±SEM) averaging the ABA scores for our data set and that of Doyle et al. (2008), ranked by P-value. Noise was estimated from similar scoring of randomly selected rat genes. (Inset) Number of gene symbols unique or common to the 2320 first clusters plotted in this graph for each data set. (B) Venn diagram of the number of gene symbols unique or common to the sets of Purkinje-specific genes defined by this work, the experiment of Doyle et al. (2008) and the CDT-DB. The gene symbols can be found in Supplemental Table S4. (C) Comparison of transcript enrichment in PCs to the relative distribution of selected proteins, detected by immunofluoescence, in vitro. Anti-calbindin D28k (Alexa546) images were thresholded to define PC regions of interest. For all tested proteins, median fluorescence intensity in the non-PC area was expressed relative to intensity in PCs (with zero indicating exclusive expression by PCs). Measurements belonging to the same replicate are coded in the same color (red, green, blue). Note that Grid2 (DELTA2R) appears here as an outlier because its most intense 5′ UTR cluster (rank, 129; LogCPM, 3.35) was not recognized as a promoter-binding region. (D–F) Representative micrographs for GRID2 (D), emerin (E), and PAX2 (F), all costained with anti-calbindin (red) and DAPI (blue). Scale bar, 50 µm.


