
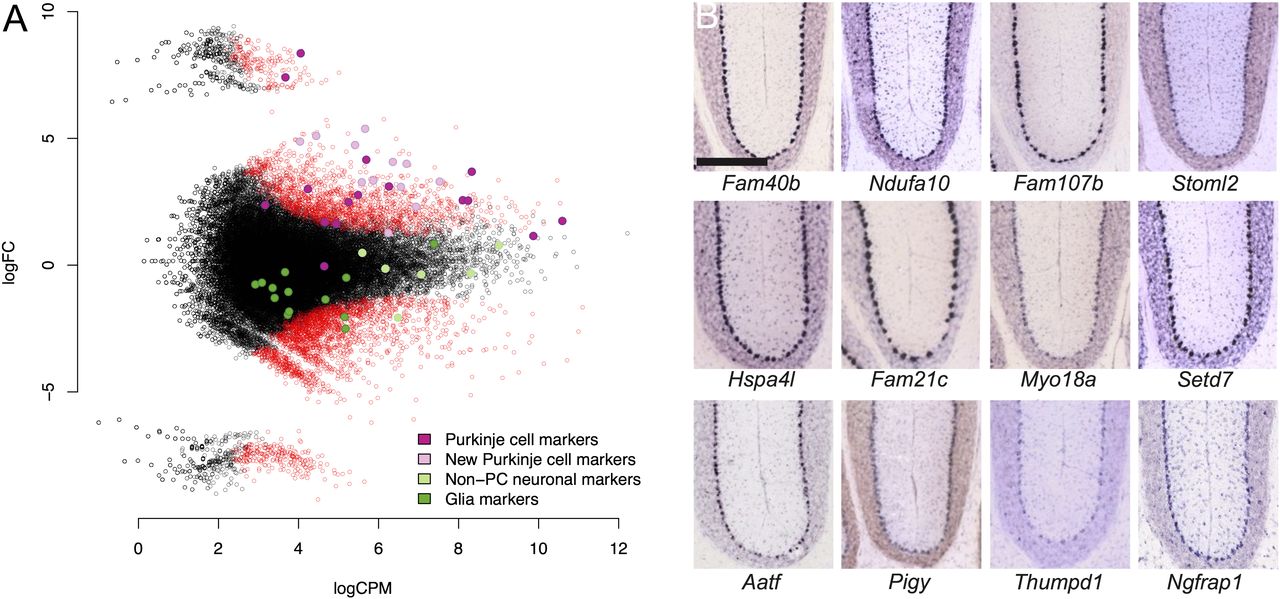
(A) Differential gene expression between the ribosome-captured (up) and control supernatant (down) samples. Each dot corresponds to a CAGEscan cluster. (X-axis) Gene expression level normalized by edgeR (log count per million); (y-axis) log2 fold change (FC) between the samples. The most extreme changes, where clusters group far from the main cloud of points, reflect a null expression in one of the samples. Open red symbols indicate clusters significantly enriched (positive FC)/depleted (negative FC) in PCs. Some clusters were annotated with markers for neuronal cells other than PCs, including granule cells (light green); glia markers (dark green); PC markers (dark magenta) and 12 clusters with strong enrichment in the bound fraction (light magenta), which can serve as novel PC markers. (B) Micrographs of sagittal sections showing in situ hybridization (Allen Brain Atlas) for the 12 new PC markers in mouse brain. Scale bar, 300 μm.


