
Figure 2.
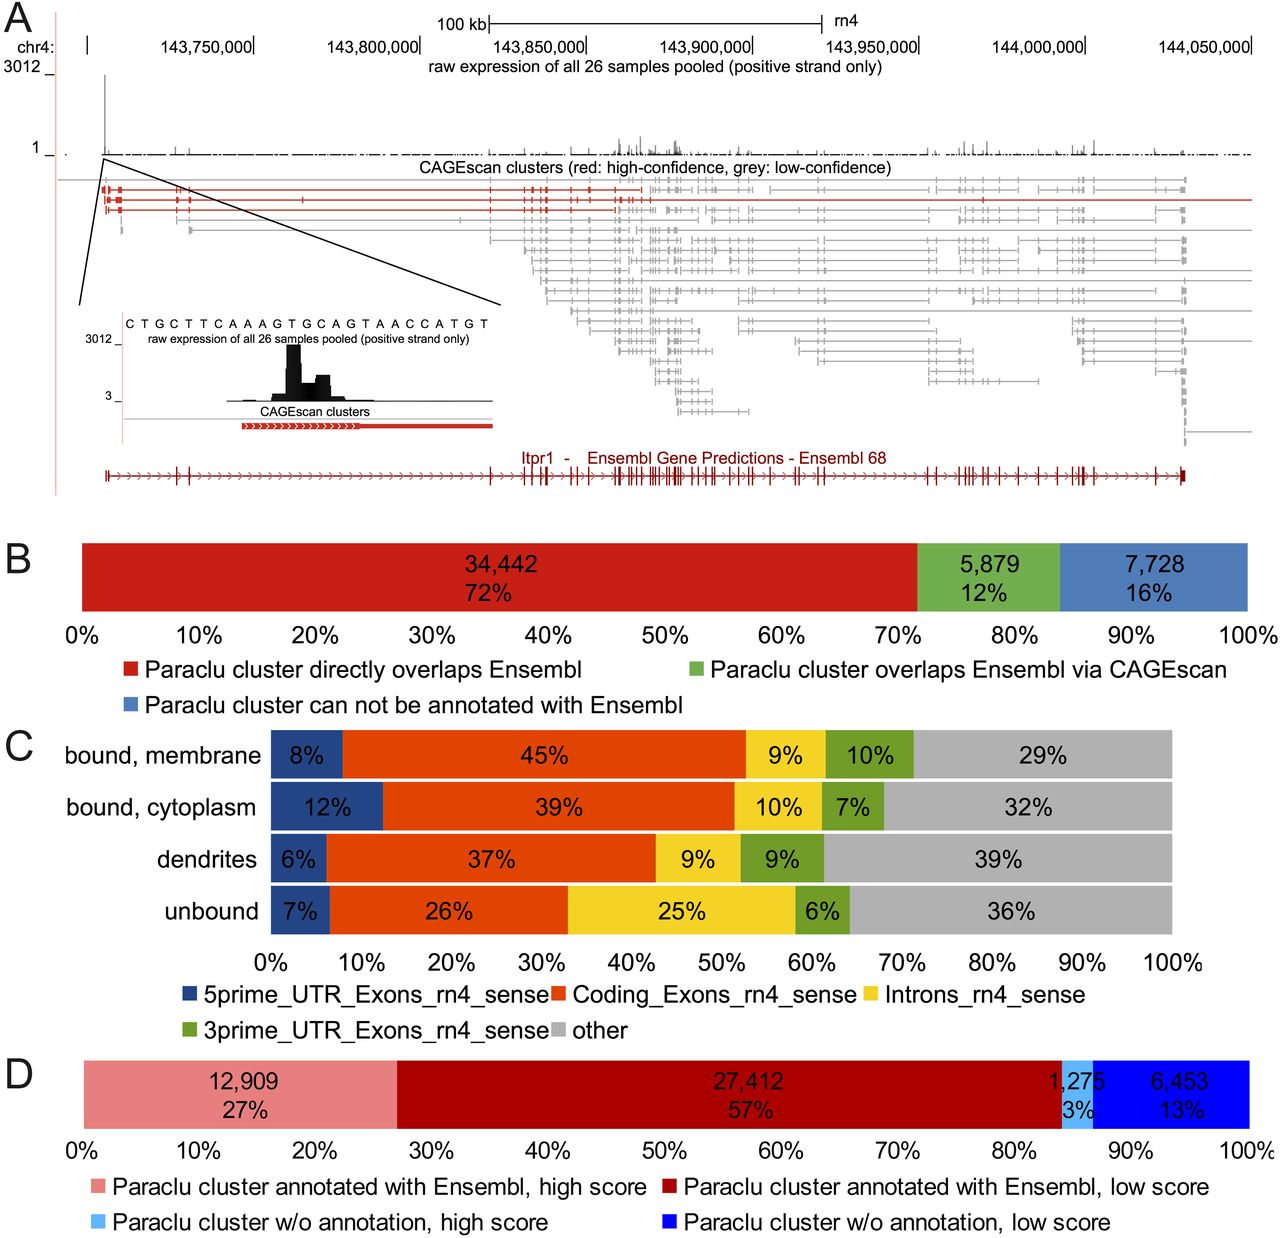
(A) Genomic representation of the PC marker Itpr1. Below the chromosomal coordinates are shown the following: (top) quantitative representation of CAGE tag abundance on the positive strand and (bottom) Paraclu followed by CAGEscan clustering groups tag into clusters (here color-coded according to the cluster’s classification score). (B) Paraclu clusters annotated with an Ensembl gene by direct overlap or via CAGEscan. (C) Percentages of the first 5′ nucleotide sequences that fall into 5′ untranslated regions, exons, introns, and 3′ untranslated regions of Ensembl genes (downloaded March 28, 2012). (D) Promoter classification.


