
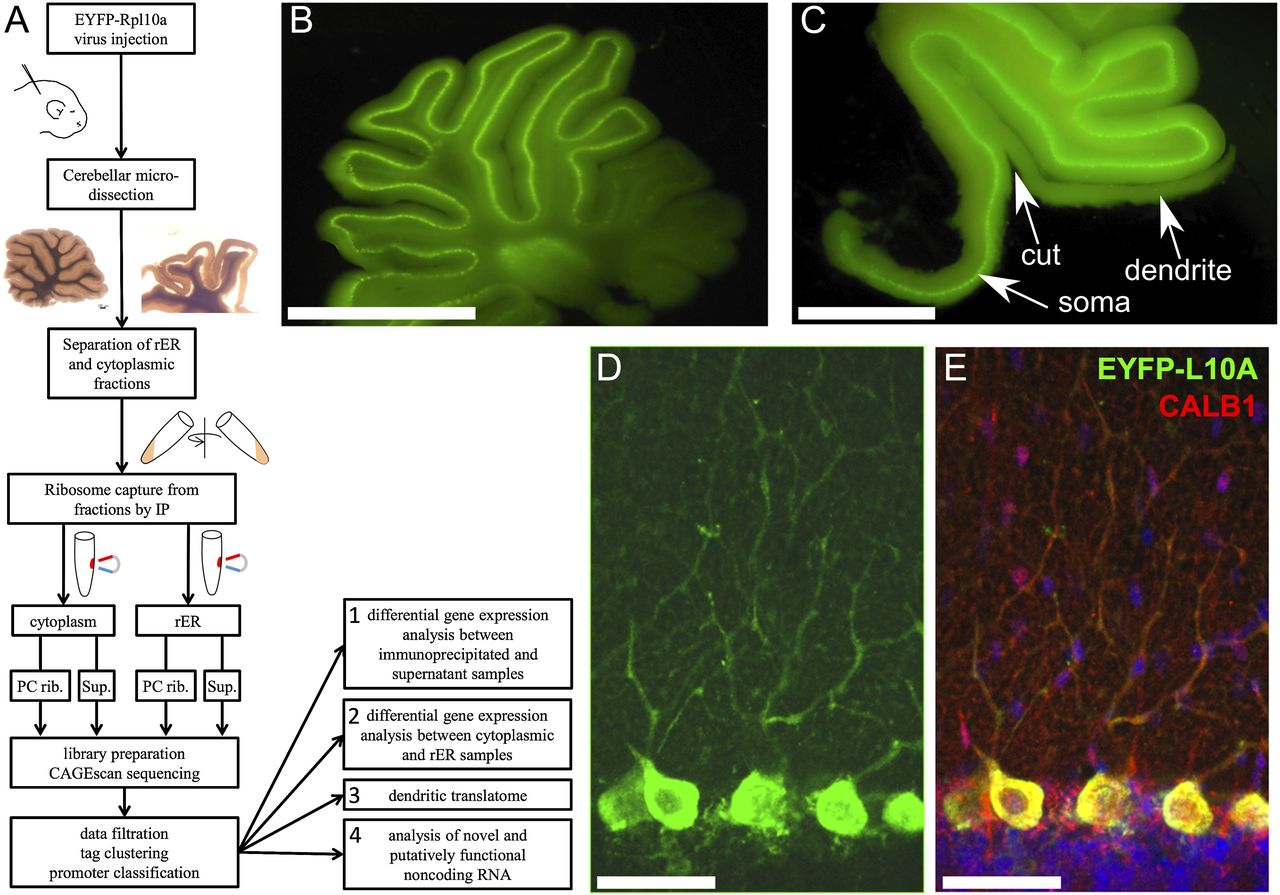
Figure 1.
(A) General layout of the study. (B) Micrograph of a live cerebellar slice (rat) showing expression of EYFP-RPL10A in the PCs and occasionally in deep-cerebellar nuclei. (C) Microdissection of the molecular layer to separate PC somata from dendrites. Scale bar, 1.76 mm. Note that most of the granular layer under the PC layer is also removed to reduce contamination. Scale bar, 2.42 mm. (D) Immunofluorescence detection of EYFP-L10A (anti-GFP) after fixation, showing intense staining of PC somata and weaker signal in dendrites. (E) Single optical section of combined staining for EYFP-L10A (green), calbindin (red), and DAPI (blue). Scale bar for D and E, 58 μm.


